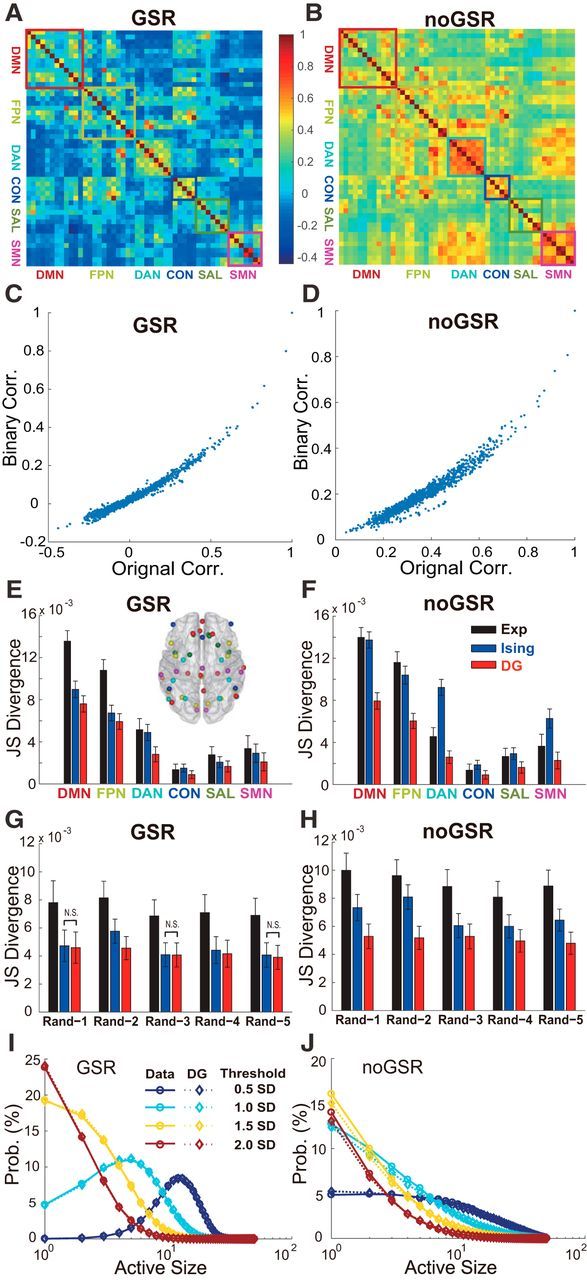
Figure 4.

Comprehensive analyses on strength of HOIs in brain networks. A, B, Correlation matrix among 50 brain regions for the GSR and noGSR conditions. Among them, six major networks are marked by colored rectangles. C, D, Comparison between the PCCs measured based on continuous BOLD signals among all 50 ROIs in the empirical data (x-axis) and their binarized counterpart (y-axis) in both the GSR (C) and noGSR (D) conditions. E, F, Prediction accuracy of the Ising and the DG models for all six typical networks under the GSR (left) and noGSR (right) conditions by using the two-fold cross-validation method. The ROIs of six networks (color coded) are marked in the horizontal view of the brain (inset). Note that the differences in absolute values of divergence were due to different sizes of the networks. G, H, To test the effects of HOIs for internetwork interactions, the same analysis as in E and F but for five 10-node networks (Rand-1 to Rand-5) with nodes chosen randomly from all 50 ROIs (without replacement) under the GSR (G) and noGSR (H) conditions was conducted. In E–H, 100 two-fold cross-validation based on randomly separating all 100 subjects into two groups (50 subjects each) were performed. The data are presented as mean ± SD. Note that all pairwise comparisons are significant unless they are marked as N.S. I, J, Probability distribution of active size, defined as number of active regions within the same time bin, for the whole network consisted of 50 ROIs from all six typical networks, under the conditions of the GSR (I) and noGSR (J). Solid lines indicate distribution estimated directly from the empirical data; dashed lines, distribution predicted by the DG model. The BOLD signals used here were based on 10-mm-radius ROIs and the threshold used here was the mean plus 1 SD unless marked otherwise.
