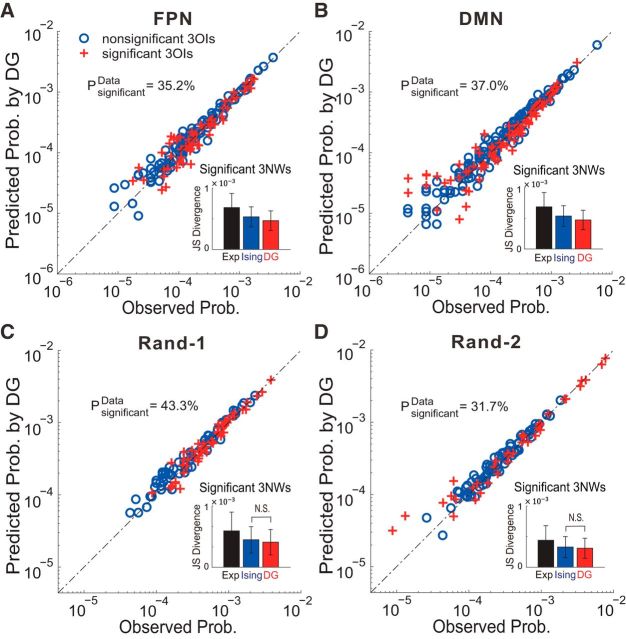
Figure 6.
Effects of HOIs on subnetworks under the noGSR condition. A, B, Observed 3OIs of 3-node subnetworks of the FPN (A) and the DMN (B) are plotted against the 3OIs of corresponding DG models. C, D, Same analysis as in A and B applied to subnetworks within the first two random networks analyzed in Figure 4H (C: Rand-1; D: Rand-2), showing the behavior of 3OIs in subnetworks with nodes belonging to different brain networks. The significant and nonsignificant 3OIs are marked with red crosses and blue circles, respectively. The dashed line represents the equality. Insets, Performance of three methods in predicting the activities of all 3-node networks (3NWs) that contains significant 3OIs was quantified by the two-fold cross-validation method. The bar diagrams represent mean ± SD of DJS. Note that all pairwise comparisons are significant unless they are marked as N.S. The binary data for the four networks used here were the same as those in Fig. 4.

