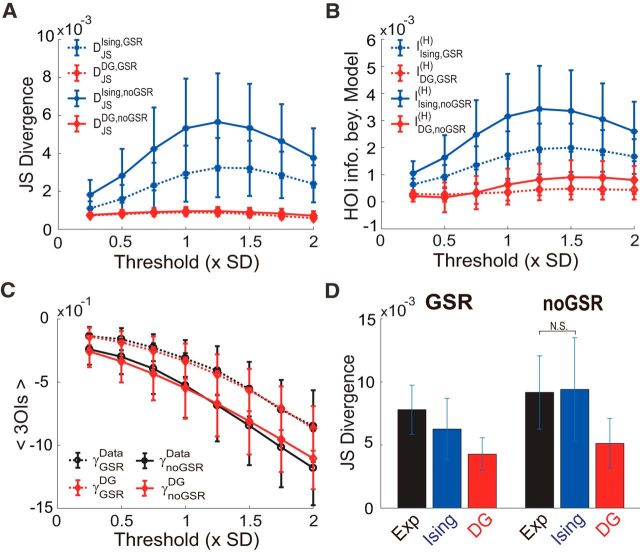
Figure 7.
HOIs in finer scale, spatial close networks. A–C, Three quantitative measures of the HOIs in networks with individual nodes in spatial neighborhood at a finer scale; 2 mm was used as the radius to define ROIs. Nine-node networks within individual coarse-grained ROIs (10-mm-radius ROI) were chosen to form a network. The results for all observable 23 such finer-scale, spatially close subnetworks are shown (mean ± SD). The analyses and meaning of markers are the same as in Fig. 3. D, Two-fold cross-validation method was used to examine the three methods' performance. The bar diagrams represent mean ± SD of DJS for individual methods across the 23 networks in the GSR and noGSR conditions. The threshold used here was the mean plus 1 SD. In A–D, all corresponding pairwise comparisons are significant except for one case marked as N.S. in D.

