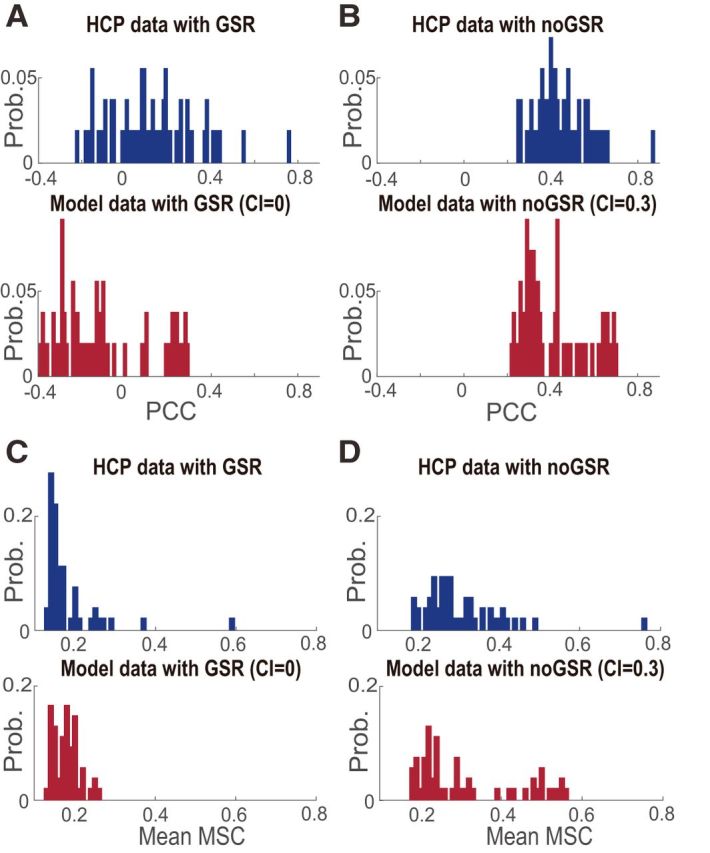
Figure 9.

Similarity in statistical features between the empirical and simulated data. A, B, Comparison between the distribution of PCCs measured for all ROIs of the FPN in the empirical data and in the simulation with the global coupling = 0.1 (see figure for details in parameter setting; CI, common input ratio), in both the GSR (A) and noGSR (B) conditions. C, D, Comparison between the distribution of mean MSC averaged across the frequency range of 0.01–0.1 Hz measured for all ROIs of the FPN in the empirical data band-pass filtered between 0.01 and 0.1 Hz and in the simulation with the global coupling = 0.1 in both the GSR (C) and noGSR (D) conditions. We note that other correlation measures, such as the Spearman correlation coefficient, gave essentially the same results.
