
Figure 2.
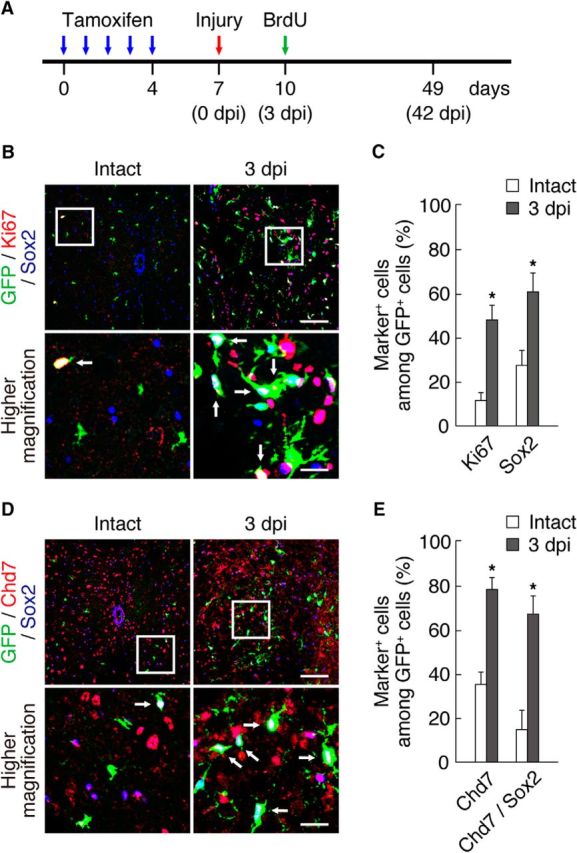
Expression of Chd7 and Sox2 in OPCs after SCI. A, Schematic diagram of the experimental design for this figure and Figures 3 and 4. Tamoxifen was administered once a day for 5 consecutive days (blue arrows), contusive SCI was performed on the mice 3 d after the last tamoxifen injection (red arrow), and BrdU was injected into the mice at 3 dpi (green arrow). The mice were analyzed at 3 and 42 dpi. B–E, The intact and injured (3 dpi) spinal cords of PDGFRα-CreER;CAG-CAT-EGFP mice were isolated and subjected to immunohistofluorescence analysis with antibodies to Ki67, Sox2, and GFP (B) and to Chd7, Sox2, and GFP (D). The percentages of marker-positive cells among total GFP+ cells were determined as means ± SD (n = 9 slices from 3 animals, Ki67: 3 dpi, t(4) = 8.35, p = 0.0010; Sox2: 3 dpi, t(4) = 5.26, p = 0.0060; Chd7: 3 dpi, t(4) = 9.11, p = 0.0010; Chd7/Sox2: 3 dpi, t(4) = 6.79, p = 0.0020; unpaired Student's t test) (C, E). Bottom, Higher-magnification views of the boxed areas in B and D. Arrows indicate triple-positive cells (B, D). *p < 0.01 versus value for intact spinal cord. Scale bars, 100 μm (B, D) and 25 μm (higher-magnification views in B, D).