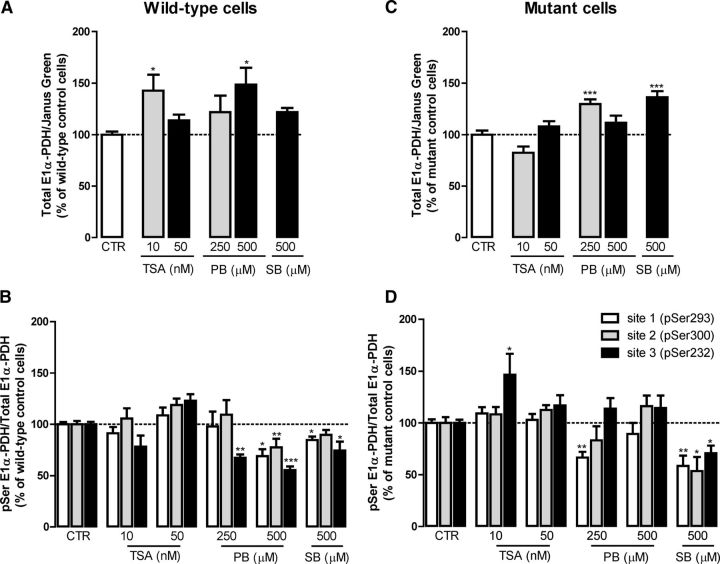
Figure 6.
Effect of HDACIs on PDH E1alpha protein levels and phosphorylation in mutant striatal cells. Wild-type (A, B) and mutant (C, D) striatal cells were incubated for 24 h with different concentrations of HDACI, TSA (10 and 50 nm), PB (250 and 500 μm), and SB (500 μm) and the levels of expression (A, C) and phosphorylation (B, D) of PDH subunit E1alpha were assessed using phospho-PDH in the cell ELISA kit. Results are expressed as mean ± SEM of three to five independent experiments (performed in duplicates or triplicates). For each graph, the wild-type (100%) values were 1.96 ± 0.96 for PDH E1alpha (A), 4.67 ± 1.33 for pSer293, 3.31 ± 1.12 for pSer300, and 7.99 ± 2.33 for pSer232 (B). The mutant control (100%) values correspond to 6.01 ± 1.93 for PDH E1alpha (C), 3.34 ± 2.32 for pSer293, 2.00 ± 1.35 for pSer300, and 2.85 ± 0.93 for pSer232 (D). Statistical analysis was performed by one-way ANOVA, followed by Bonferroni post hoc test: *p < 0.05, **p < 0.01, and ***p < 0.001 compared with wild-type cells.

