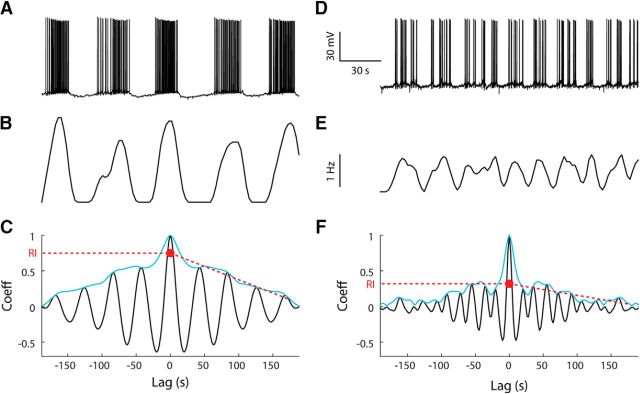
Figure 1.
AOB mitral cells exhibit infra-slow bursting. A, Voltage recording from an AOB mitral cell showing highly rhythmic bursting. B, Smoothed time histogram (2 s bins) of the firing shown in A. C, Autocorrelation function of the histogram shown in B demonstrating the method of RI extraction (red) based on the envelope (blue, Hilbert transform power function) of the autocorrelation function. D–F, Similar to A–C but applied for a recording from a less rhythmic mitral cell.

