Figure 2.

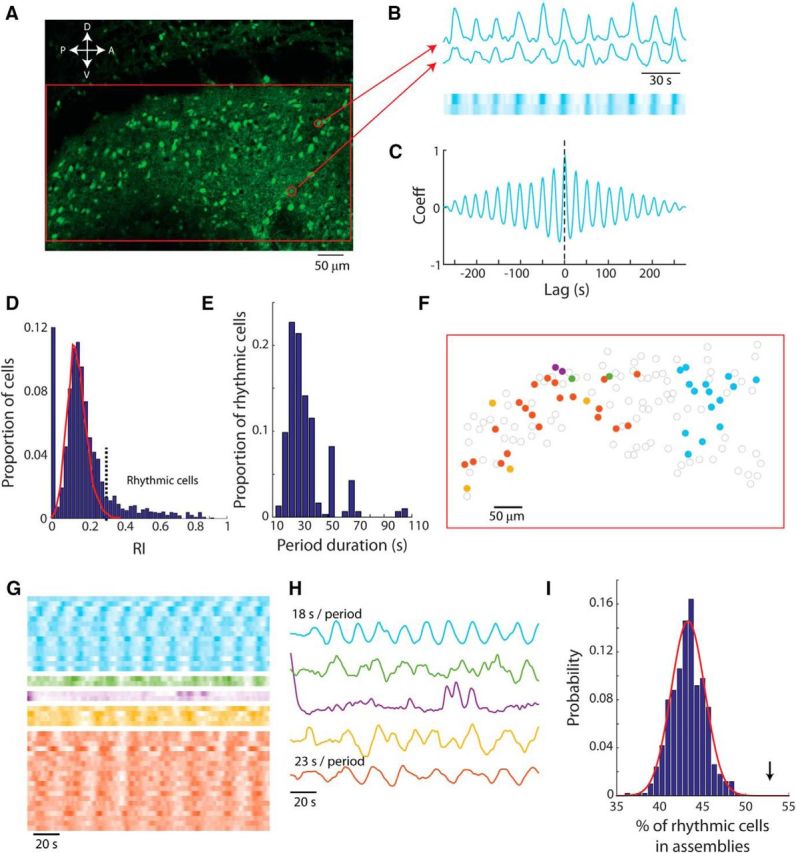
Synchronous rhythmic bursting in mitral cell assemblies is revealed by two-photon imaging. A, Image of AOB slice incubated with OGB-1 AM showing the area mapped in E (red rectangle). White arrows denote tissue orientation (A, anterior; P, posterior; D, dorsal; and V, ventral). B, Fluorescence intensity of two example cells from A shown as a waveform (top) and raster plot in which color intensity denotes fluorescence intensity (bottom). C, Cross-correlation function based on the signals of the two cells shown in B. D, Distribution of RIs in all observed cells from 21 slices (blue bars) and distribution of RIs in a simulated population of random signals (red line). E, Distribution of period duration in all rhythmic cells (n = 304). F, Map of the detected mitral cells in the slice shown in A in which synchronous cells are similarly colored. Noncolored cells are not synchronous and may be rhythmic, not rhythmic, or not active. G, Calcium indicator fluorescence displayed in raster plot (as in B) for all the cells marked in F clustered to synchronous assemblies and ordered by relative phase within each assembly. H, Average fluorescence in each assembly calculated after eliminating phase differences between cells. The period durations of two rhythmic assemblies are presented above their traces. I, Histogram of the probability of rhythmic cells to belong to a synchronous assembly as calculated in 500 resampled populations (blue bars) and the fitted normal distribution (red line). The arrow indicates the value calculated based on experimental results.
