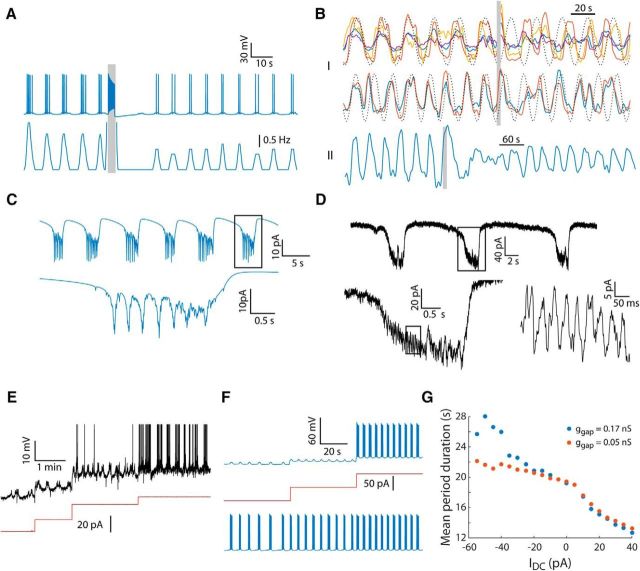
Figure 6.
Model glomerulus predicting multiple experimental observations. A, Simulating an afferent stimulus in a 20-cell glomerulus showing membrane potential of a representative cell (top) and its firing histogram (bottom). Synchronous rhythmic bursting was induced by a first stimulus (data not shown), whereas the second stimulus (gray line) was given during synchronous bursting, showing the resulting phase delay and reduction in intraburst firing frequency. B, “I,” Fluorescence of four cells that form one assembly (top) and another two cells that form a second assembly in the same slice (bottom). Local electrical stimulation (gray bar) evoked an immediate response followed by a marked delay, as indicated by the dotted line that shows sinusoidal functions that approximately follow the fluorescence before the stimulation and predicts the expected activity without stimulation. “II,” Fluorescence of a different cell that shows a marked reduction in the amplitude of the rhythmic activity after the stimulation (gray bar). C, Current in a simulated mitral cell belonging to a 35-cell glomerulus clamped to −70 mV in the absence of chemical synaptic transmission showing rhythmic episodes of inward current (top) composed of summation of unitary events (bottom). D, Current recorded experimentally in a mitral cell after blocking synaptic transmission by substitution of extracellular Ca2+ with Mg2+ showing similar results in terms of both the rhythmic episodes and the unitary events. E, Whole-cell recording of an AOB mitral cell (black) during injection of hyperpolarizing current steps (red). F, Simulated injection of hyperpolarizing DC current to a member cell from a 20-cell glomerulus. In the injected cell (top), prevention of action potentials by hyperpolarization revealed rhythmic subthreshold events of which the period duration increased with further hyperpolarization. The similar change in activity in another cell from the same glomerulus (bottom) shows that this effect is a network property. G, Period duration of synchronous bursting in a model 20-cell glomerulus as a function of the DC current injected to a single cell, when 0.17 nS (blue) or 0.05 nS (orange) were used as gap junction conductance.

