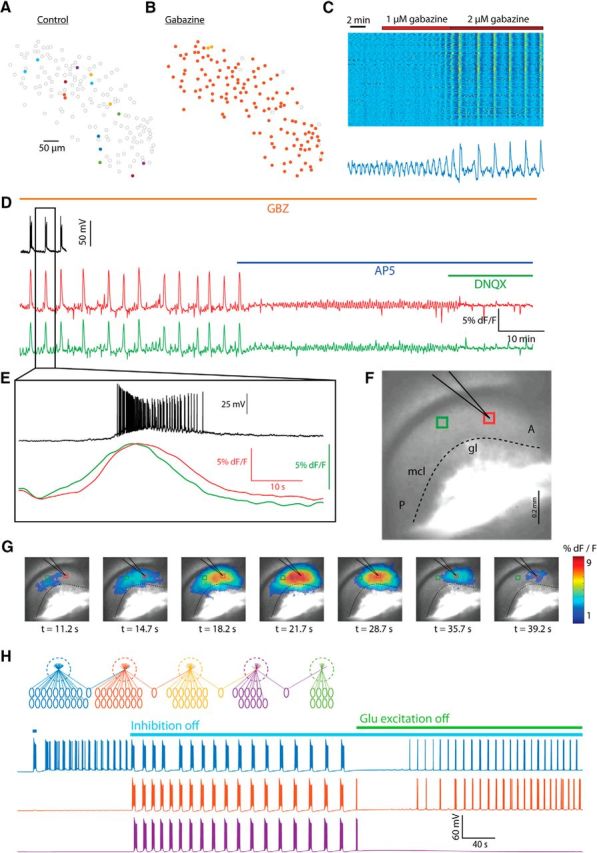
Figure 7.

Inhibitory interactions determine the size of assemblies and the extent of rhythmicity and restrict interglomerular burst propagation. A, Map of an AOB slice in control conditions showing seven assemblies (color coded) of correlated activity. B, Map of the same slice after gabazine application showing global synchrony. C, Top, Raster plot of the fluorescence of cells from the slice shown in A and B before and during gabazine application (red bar). Note the emergent of global synchronous rhythmicity. Bottom, Example of the fluorescence recorded from a single cell bursting under control conditions demonstrating an increase in amplitude and interburst interval in the presence of gabazine. D–G, Wide-field imaging of an AOB slice in which GCaMP6 is expressed in mitral cells in the presence of gabazine. D, Simultaneous recording of electrical activity (black trace) and fluorescence changes in a two ROIs marked in E with corresponding colors. APV (blue bar) and DNQX (green bar) were added sequentially. E, Magnification of a single event marked in D, showing the temporal relationship among the signals. F, Photomicrograph of the imaged area, showing the locations of the recording pipette (black) and the ROIs (red and green squares). mcl, Mitral cell layer; gl, glomerular layer; P, posterior; A, anterior). G, Time-lapse imaging of the propagation of the burst of activity shown in E. H, Reproducing the blockers' effects in a network of five glomeruli of different sizes, in which pairs of “adjacent” glomeruli share mitral cells. Electrical activity of representative cells from the three glomeruli is shown in matching colors. The blue glomerulus was stimulated (blue bar) to initiate synchronous bursting activity that spread to adjacent glomeruli upon blockade of synaptic inhibition (cyan bar). After blockade of synaptic excitation (green bar), modified synchronous bursting activity continues in some of the glomeruli.
