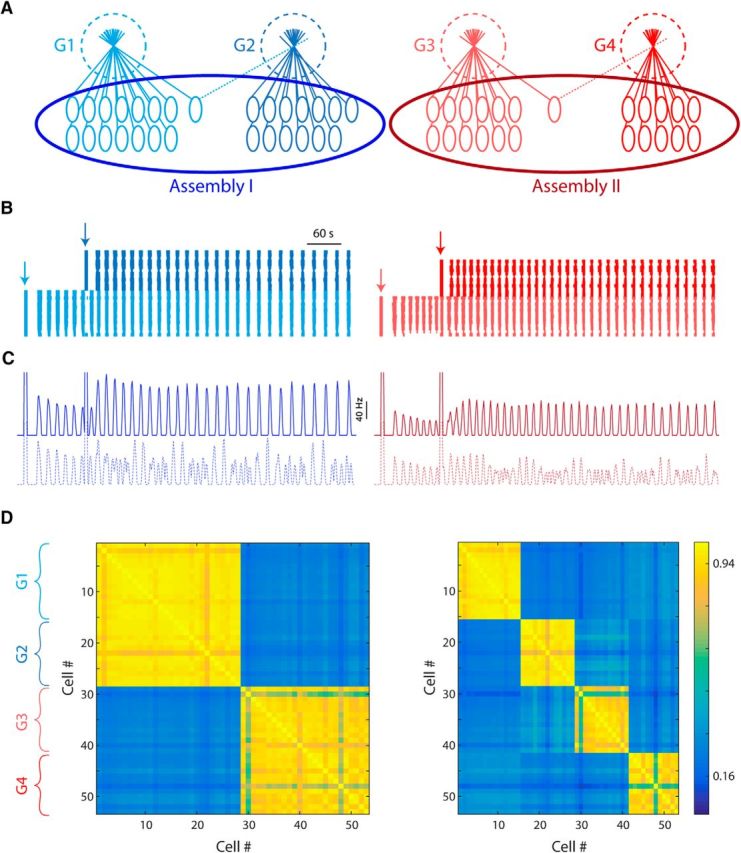
Figure 8.

Interglomerular interactions enable integration of inputs over extended time scales. A, Network topology used in the simulation, containing four glomeruli of 15, 13, 13, and 12 member cells. Each pair form an assembly via one shared cell that project dendrites to both glomeruli. The lateral excitation and inhibition weights are slightly different in each assembly. B, Raster plot showing the firing of the cells from assembly I (left) and assembly II (right) color coded to match the glomeruli. Times of stimulation of each glomerulus are denoted by vertical arrows. C, Population firing time histogram for each glomerulus in the original topology (top, solid lines) and in the absence of shared cells (bottom, dotted lines). D, Correlation matrix of the entire population, ordered by glomeruli, in the original topology (left) and in the absence of shared cells (right). Note that correlated activity between the glomeruli of each assembly occurs only when shared cells are present and it is independent of the time of stimulation.
