Figure 3.
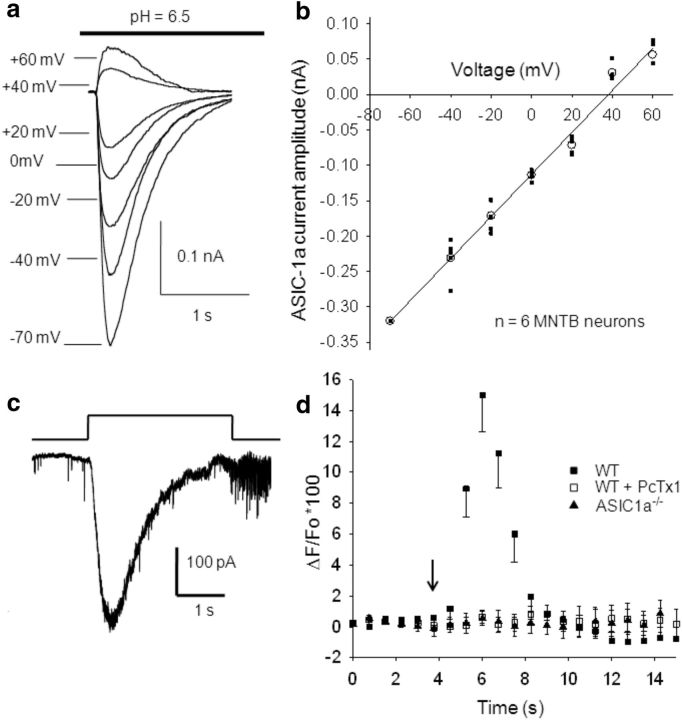
Voltage dependence of ASIC currents and ASIC permeability to Ca2+. a, Representative traces showing IASICs activated by a 3-s-long pH drop from 7.3 to 6.5 while MNTB neurons were whole-cell patch clamped at different holding potentials. After returning to pH 7.3, cells were allowed to recover for 2 min. b, Mean I–V plot for ASIC currents activated by a 3-s-long pH drop from 7.3 to 6.5 (n = 6). The detection of calcium transients evoked during the activation of ASIC-1as by H+ injection. c, Representative traces of ASIC currents evoked by H+ iontophoresis in WT mice. The bar indicates the positive current pulse (2 nA, 3 s-duration) applied to a micropipette filled with HCl 0.1 m through a monopolar filament. d, Changes in calcium-sensitive indicator ΔF/F0 as a function of time. The arrow indicates the time of iontophoretic injection of H+. In MNTB neurons from WT mice, the Ca2+-dependent fluorescence rises up to 15 ± 3% (filled squares, n = 9), indicating that Ca2+ enters into the MNTB neuron through ASIC-1as when these are activated by H+. This increment in [Ca2+] is abolished when PcTx1 is applied to the bath solution (open squares; n = 8) and was not observed in MNTB neurons from ASIC1a−/− mice (filled triangles; n = 4).

