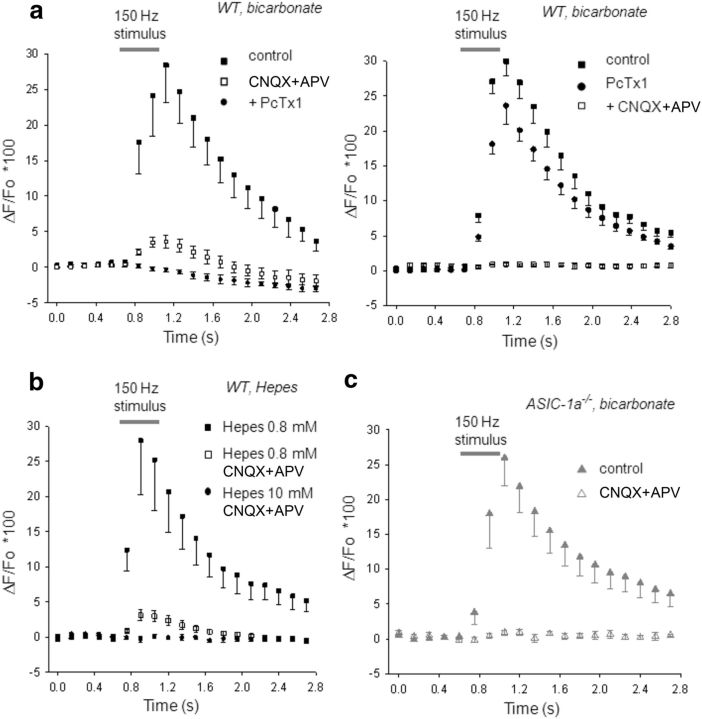
Figure 5.
ASIC-1a-dependent increase of intracellular Ca2+ in MNTB neurons during HFS. a, Time course of the Fluo 8 fluorescence emission ratio (ΔF/F0) in postsynaptic MNTB neurons from WT mice (n = 9) during presynaptic HFS (150 Hz, 0.4 s; indicated by gray bar) in normal bicarbonate-based aCSF. Images were taken every 140 ms (first six images before stimulation served as the baseline). Left, During HFS, a maximum increase in intracellular Ca2+ of 28 ± 5% (n = 9) is observed (filled squares; control). After AMPA/kainite glutamate receptor inhibition with 40 μm CNQX (open squares, CNQX), a small component of the fluorescence increment (peak, 3.8 ± 0.9%; n = 9) remained during 150 Hz stimulation. PcTx1 inhibited this residual fluorescence (circles, + PcTx1; p < 0.05, one-way repeated-measure ANOVA). Right, Applying drugs in reverse order, PcTx1 reduced the maximum increase in intracellular Ca2+ of 29 ± 2% in control conditions (n = 10; filled squares, control) to 24 ± 3% (circles, PcTx1), while the addition of CNQX abolished any increase in fluorescence during 150 Hz stimulation (open squares, CNQX). b, Changing the pH buffer capacity of the aCSF alters ASIC-1a-dependent Ca2+ entry in MNTB neurons from WT mice. Plot of ΔF/F0 versus time during HFS in a low-pH buffer capacity aCSF before (filled squares, HEPES 1 mm; peak increase, 28 ± 8%; n = 9) and after the inhibition of glutamate AMPA and NMDA receptors (open squares, HEPES 1 mm plus CNQX+APV; peak increment, 3.2 ± 0.8%, n = 9). This remaining fluorescence component that may be attributed to Ca2+ influx through ASIC-1as was eliminated when a high-pH buffer capacity aCSF inhibits acidification (circles, HEPES 10 mm; n = 9; p < 0.05, one-way repeated-measures ANOVA). c, Time course of ΔF/F0 in postsynaptic MNTB neurons from ASIC1a−/− mice during HFS (150 Hz, 0.4 s) in normal bicarbonate-based aCSF (filled triangles, control; n = 8). The maximum increase in [Ca2+] through AMPA receptors (26 ± 5%) is not statistically different from that observed in WT mice (p > 0.05, Student's t test, WT vs ASIC-1a−/−). After glutamate AMPA and NMDA receptor inhibition, the increase in fluorescence is completely eliminated (open triangles, CNQX+APV; n = 8).

