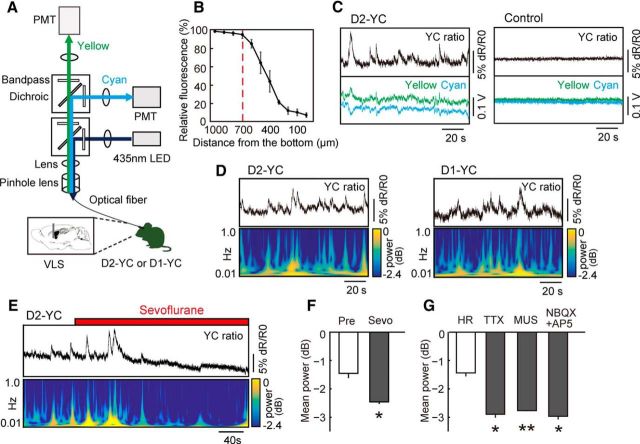
Figure 2.
Optical measurement of neuronal activity in D2- and D1-MSNs in freely moving mice. A, Schematic of fiber-photometric system. Light path for fluorescence excitation and emission is through a single multimode fiber connected to the optical fiber cannula implanted in the VLS. The fluorescence emission is separated in two by a dichroic mirror, and cyan and yellow fluorescence are corrected through bandpass filters and enhanced by photomultiplier tubes. B, Estimating the effective detection range of the fiberphotometry. When we carefully inserted the optical fiber cannula into the VLS in the fixed brain slice of a D2-YC mouse put on a black shading plate, >10% reduction of fluorescence was observed beyond the distance of 700 μm from the bottom. n = 4 slices from 2 brains. C, Example of yellow/cyan fluorescence intensity ratio (YC ratio; top) and corresponding fluorescence intensity changes of yellow and cyan fluorescence (bottom) recorded in the VLS in D2-YC (left) and wild-type control (right) mice, respectively. D, Examples of YC ratio (top) and corresponding power spectral data (bottom) in the VLS in D2-YC (left) and D1-YC (right) mice, respectively. YC ratio was recorded from a freely moving mouse in the home cage. E, The diminishment of YC ratio in the VLS of D2-YC mice under sevoflurane anesthesia. F, The effect of sevoflurane on YC ratio (power value) in the VLS of D2-YC mice. *p < 0.05, compared with pretreatment (paired t test). n = 4. G, The response of YC ratio (power value) in the VLS of D2-YC mice to microinjection of HEPES-Ringer's solution (HR), TTX, MUS, NBQX, and AP-5. *p < 0.05, compared with HR as a control (Student's t test with Bonferroni correlation). **p < 0.01, compared with HR as a control (Student's t test with Bonferroni correlation). n = 4 for each drug. Error bars indicate ± SE.

