Figure 3.
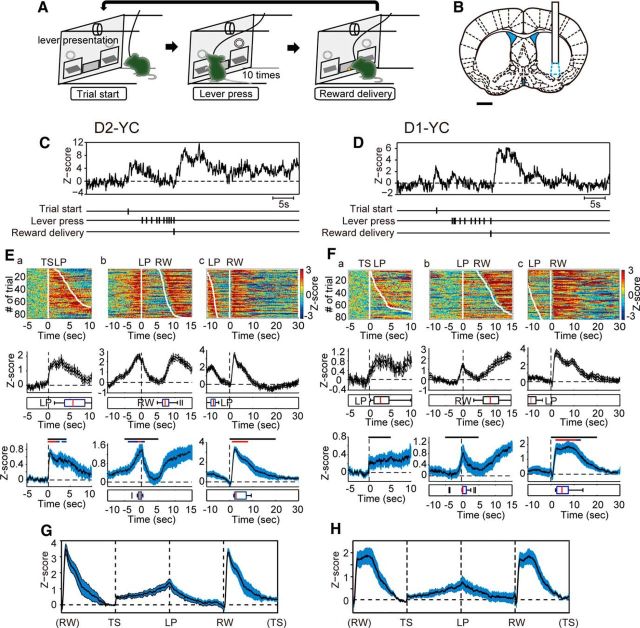
Temporal changes of compound intracellular Ca2+ signals in VLS D2- and D1-MSNs during an operant task. A, Schematic illustration of the fixed ratio (FR)-10 operant task sequence. B, Recording site of Ca2+ signal of D2- or D1-MSNs in the VLS (cyan-dotted region). Scale bar, 1 mm. C, D, Representative trace of compound intracellular Ca2+ transients in VLS D2- (C) and D1-MSNs (D), respectively. Vertical ticks indicate time stamps of TS, each LP, and RW. E, F, Temporal changes of Ca2+ signals in VLS D2- (E) and D1-MSNs (F) aligned to the timing of TS (a), first LP (b), and RW (c), respectively. Top row, Color-coded compound Ca2+ signals in one representative session (85 trials, E; and 79 trials, F) sorted by TS-LP latency or LP-RW duration. Middle row, Averaged signals from the same session in the top row. Boxplot represents the timing of LP (a), RW (b), and LP (c), respectively. Bottom row, Averaged signals from all sessions of all mice (n = 12 sessions from 4 mice). Black bar represents the statistical period. Blue bar represents p < 0.05. Red bar represents p < 0.01. Paired t test with Bonferroni correction: mean Z score during 5 s just before TS vs that during each 1 s period for 5 s after TS (a), respective 5 s before and after LP (b), or 20 s after RW(c). Boxplots represent the peak of Ca2+ signal within the statistical period. G, H, Trace of averaged VLS D2- (G) and D1-MSN (H) Ca2+ signals from all sessions in which the duration between trigger points was normalized. E, G, n = 12 sessions from 4 D2-YC mice. F, H, n = 15 sessions from 5 D1-YC mice. Shadow areas represent ± SE.

