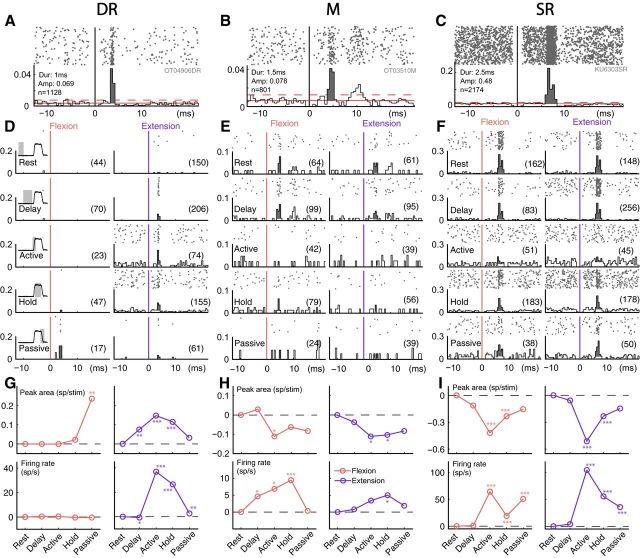
Figure 4.
Example of evoked response and firing rate modulation in three SLNs. A–C, Raster plot and PSTH of three SLNs using all stimulation pulses applied during the task. PSTH bin size = 0.5 ms. Dur, Duration of the evoked response; Amp, amplitude. All conventions are otherwise similar to Figure 1C. D–F, Raster plot and PSTH of the three SLNs shown in A–C, divided into five behavioral epochs (rows) and two movement directions (columns). Behavioral epochs are illustrated by traces of wrist torque, shown as insets on the left of A. Active, Active movement; passive, passive movement. Colored vertical lines indicate the timing of stimulation (red represents flexion trials; blue represents extension trials), and numbers in parentheses indicate the number of stimulation pulses in a given behavioral condition. The peak area represents the gray zone in the PSTH. White part at bottom of the peak represents the baseline mean firing rate preceding the stimulation pulse. x-axis indicates time in milliseconds. y-axis indicates spiking probability. PSTH bin size = 0.5 ms. G–I, Difference in peak area (top) and mean firing rate (bottom) between rest and the four other behavioral epochs, corresponding to the SLNs shown above. Left plots, Flexion movements (red). Right plots, Extension movements (blue). *p < 0.05, significant difference in peak area or mean firing rate between rest and another epoch. **p < 0.01, significant difference in peak area or mean firing rate between rest and another epoch. ***p < 0.001 significant difference in peak area or mean firing rate between rest and another epoch. Peak area, Binomial test. Firing rate, Mann–Whitney U test. A, D, G, DR example neuron. B, E, H, M example neuron. C, F, I, SR example neuron.

