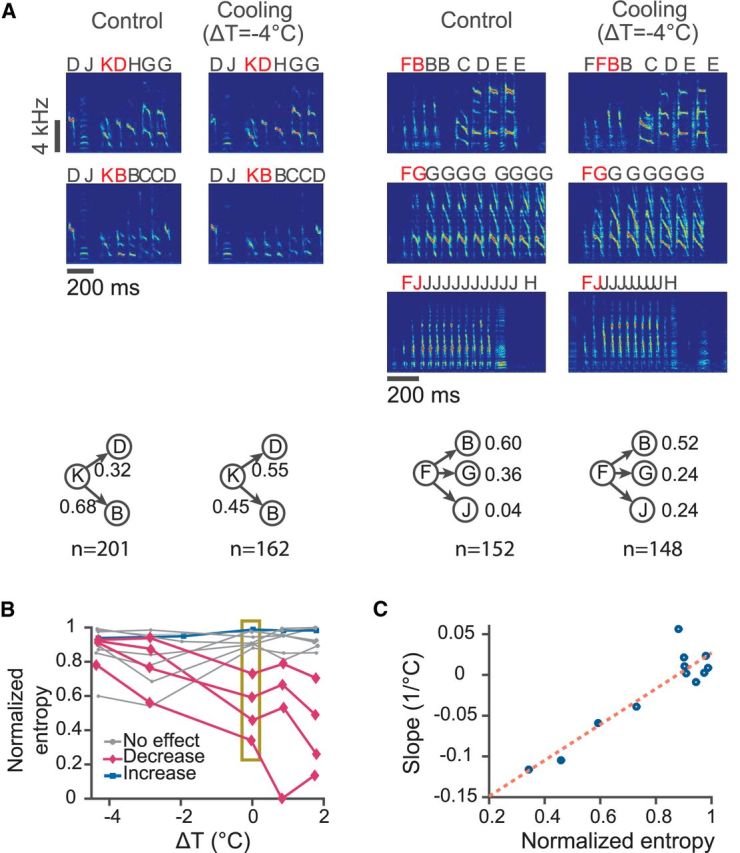
Figure 4.

Effects of HVC temperature on branch points in the song syntax. A, Two examples of branch points affected by HVC temperature. Left, Top, Spectrograms of song segments showing that syllable “K” can be followed by either syllable “B” or syllable “D.” Bottom, Transition probabilities from “K” to “B” or “D” under control and 4°C cooling conditions. Right, Top, Spectrograms showing that syllable “F” can be followed by short repeat “B,” long repeat “G,” or “J.” Bottom, Transition probabilities from “F” to “B,” “G,” or “J” under the normal and 4°C cooling conditions. B, Dependence of the transition entropy on HVC temperature for all branch points. Entropies are normalized by their maximum possible values. Magenta curves are branch points that show a significant decrease in transition entropy as temperature increases; blue curves show a significant increase; gray curves show branch points with no significant change (t test on slope). Transition entropies at ΔT = 0 are within the box and are used on the abscissa in C. C, Slopes of the normalized entropy versus ΔT curve plotted with respect to the normalized entropy at ΔT = 0. The correlation is significant (r = 0.92, p = 1.2 × 10⁻⁵, t test).
