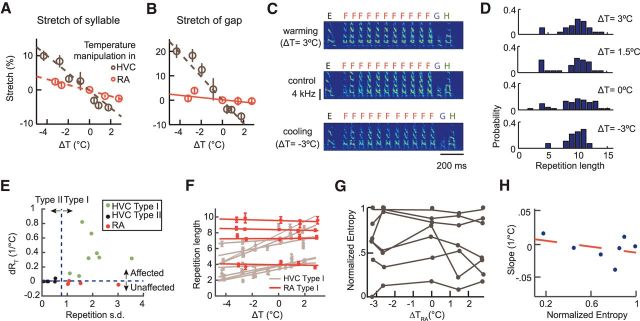
Figure 6.
Effects of RA temperature on song timing and syntax. A, Mean fractional stretch of syllables (n = 22) at various RA temperatures compared with the stretch with changing the temperature of HVC. Error bars indicate SEM. B, Mean fractional stretch of gaps (n = 34) at various RA temperatures compared with the stretch with changing the temperature of HVC. C, Spectrograms showing the repetition of syllable “F” at different RA temperatures. D, Histograms of the repetition length of syllable “F” under different RA temperatures. Cooling RA does not shift the distribution of the repetition length. E, RA cooling does not decrease syllable repetitions for type I repeated syllables as defined with the variability of repetition length at the normal conditions (red dots). This is compared with the type I (purple) and type II (black) syllables from the HVC cooling experiments. F, Mean repetition length of the type I repeated syllables at different temperatures under RA cooling (red) compared with HVC cooling (gray). Error bars indicate SEM. G, Normalized transition entropy of the seven branch points from two birds at different RA temperatures. All curves have slopes that are not significantly different from zero. H, Slope of the curves with respect to the normalized entropy at ΔT = 0. The slopes are not correlated with the transition entropy at ΔT = 0 (p = 0.21, t test).

