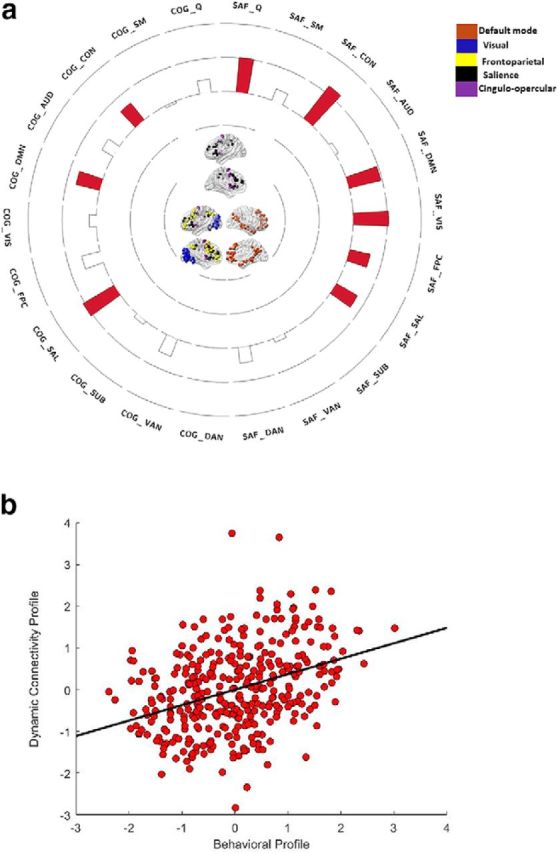
Figure 1.

a, The loadings of the brain variables from CCA 1 on their corresponding canonical variate. b, Scatter plots describing the linear association between the brain and the behavioral (i.e., age and inhibitory control) canonical variates. a, COG_, Working memory context; SAF_, social-affective context; Q, whole-brain modularity metric. a, Networks with significant loadings on the respective brain variate are represented in the middle of the circular plot, separately for the cognitive (on the left side) versus the social-affective (on the right side) context. Bars in red represent positive loadings of a brain variable on its variate. In the circular plot, the outermost ring represents a canonical loading of 1.0 and the second ring (from the outside) represents a canonical loading of 0.50. Complementarily, the innermost ring represents a canonical loading of −1.0, whereas the second ring from the center of the circular plot represents a canonical loading of −0.50. The networks presented in Figures 1 and 2 were visualized with the BrainNet Viewer (Xia et al., 2013).
