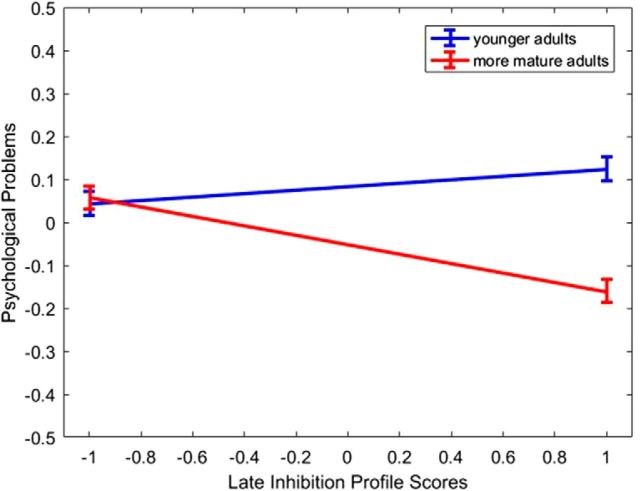
Figure 3.
The relationship between life functioning and scores on the late inhibition profile as a function of age. The representations are based on estimates from the HLM model presented in Table 8, in which all other predictors apart from age, scores on the later adulthood inhibition profile, and their interaction term have been set to their mean value. Although age was used as a continuous variable in the analyses, for the purpose of graphing the interaction, it is broken into younger (i.e., 1 SD below the average age of the sample) and more mature adulthood (i.e., 1 SD above the average age of the sample).

