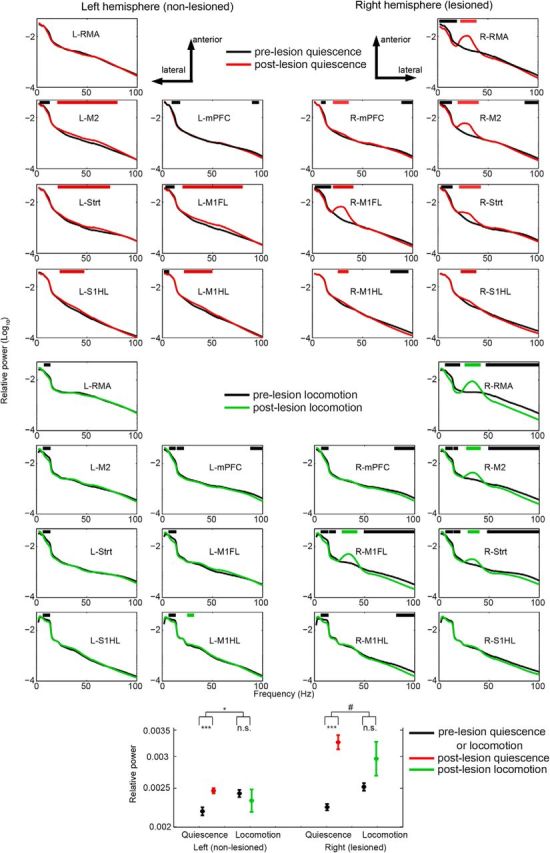
Figure 2.

Changes in LFP power after nigrostriatal dopamine degeneration. Average relative power (shading represents SEM over recording sessions) at baseline (pre, black) and lesioned (post: >14 d after 6-OHDA injection) conditions for quiescence (red) and locomotion (green). Horizontal red and green bars indicate significant increments prelesion and postlesion respectively. Black bars indicate significant decrements (p < 0.05). x-axis, frequency (Hz); y-axis, relative power (log10 transformed). *p < 0.05 two-way ANOVA, main effect of behavior, ***p < 0.01 Student's t-test, # 0.05 < p < 0.10 two-way ANOVA, main effect of behavior.
