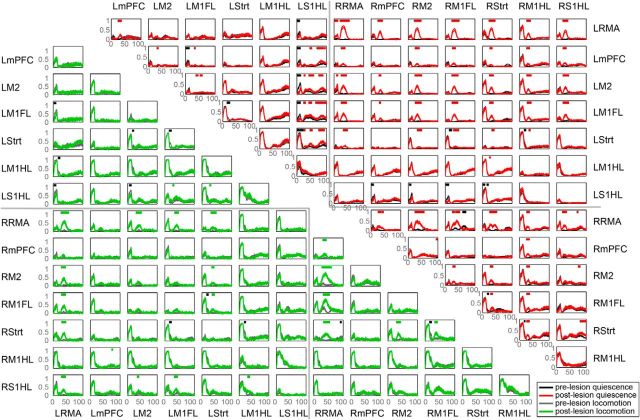
Figure 3.
Interregional functional connectivity changes after the 6-OHDA lesion. PLI for prelesion and postlesion conditions per region pair. Quiescent state connectivity in prelesion (black) and postlesion (red) conditions are to the right of the diagonal. Locomotion-related connectivity in prelesion (gray), and postlesion (green) conditions is shown to the left of the diagonal. Horizontal red and green bars indicate frequencies of significantly increased connectivity for quiescence and locomotion, respectively. Black bars indicate frequencies of significantly decreased connectivity (p < 0.05).

