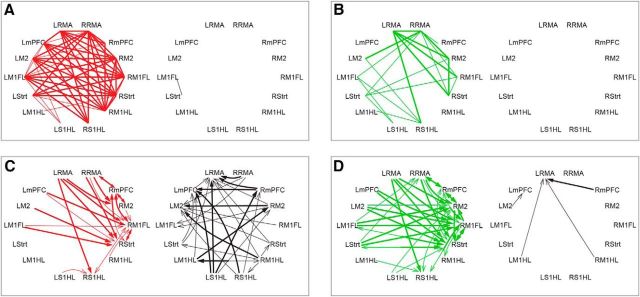
Figure 4.
Spatial representation of functional connectivity and GC changes in the beta frequencies. Significantly increased (red/green in conditions sit/walk, respectively) and decreased (black) functional connectivity plotted for sit (A) and walk (B) conditions in the top row. Bottom row represents significant changes in GC after the 6-OHDA lesion in the two behavioral conditions (C, D). Thin/thick lines and arrows indicate extent of significant changes whenever present for >5 Hz/10 Hz wide, respectively.

