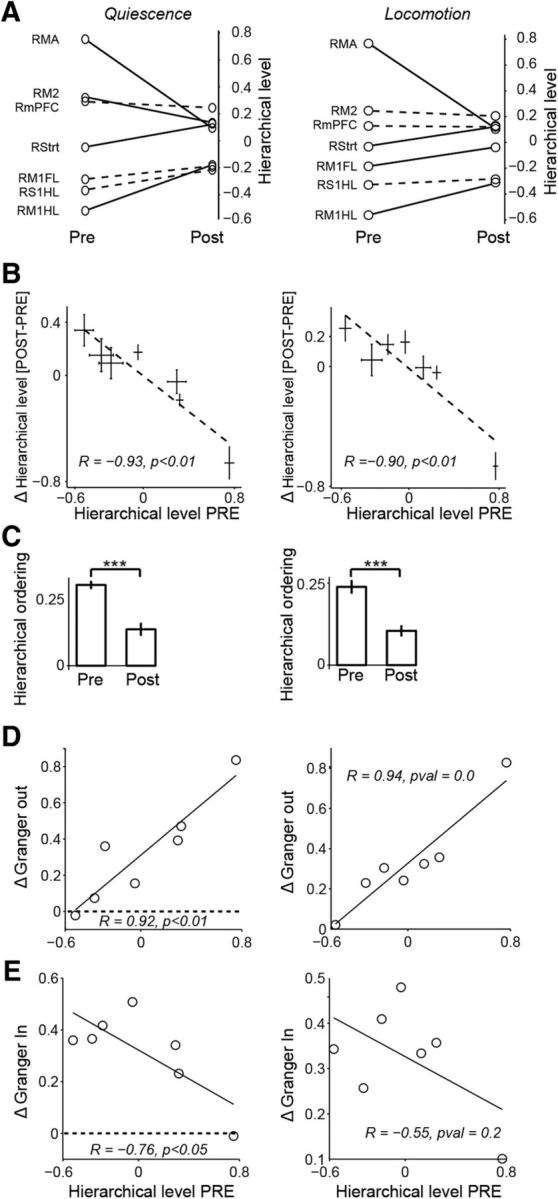
Figure 7.

Changes in cortical hierarchy after 6-OHDA lesion. A, Hierarchical level for each brain area prelesion and postlesion during quiescence (left) and locomotion (right). Hierarchical level was computed as the average DAI, which equals [GCin − GCout]/[GCin + GCout] where GC is the GC influence. Solid lines indicate areas for which the hierarchical level showed a significant change postlesion (two-sample t test, p < 0.05). B, Hierarchical level prelesion versus the change in hierarchical level from prelesion to postlesion. Left, Quiescence. Right, Locomotion. C, Hierarchical ordering of the network, which was quantified as the variance of the hierarchical levels across areas. Left, Quiescence. Right, Locomotion. D, Change in GC outflow as a function of the prelesion hierarchical level. Areas at the top of the hierarchy increase their GC outflow. E, Change in GC inflow as a function of the prelesion hierarchical level. Areas at the top of the hierarchy tend to receive more GC inflow postlesion during quiescence, but not during locomotion. ***p < 0.01, Student's t-test.
