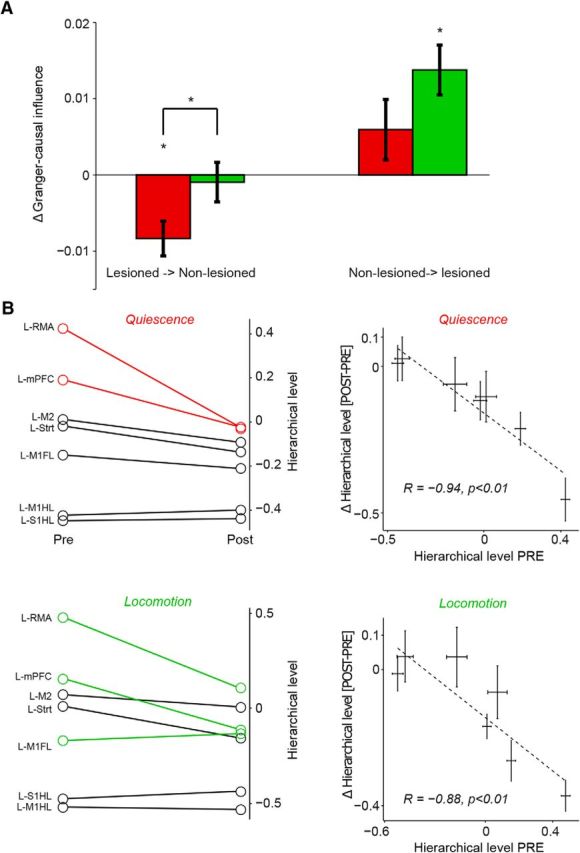
Figure 8.

Changes in interhemispheric interactions after 6-OHDA lesion. A, Change in GC influence from lesioned to nonlesioned and nonlesioned to lesioned hemisphere (see Materials and Methods), separately for locomotion (green) and quiescence (red). B, Left, Changes in GC influence, expressed as a difference in DAI values, between prelesion and postlesion conditions. Red and green lines indicate areas for which the hierarchical level showed a significant change postlesion (two-sample t test, p < 0.05), separately for quiescence and locomotion, in 20–40 Hz band. Right, Hierarchical level prelesion versus the change in hierarchical level from prelesion to postlesion. Top, Quiescence. Bottom, locomotion. *p < 0.05, two-way ANOVA (main effect), or Student's t-test.
