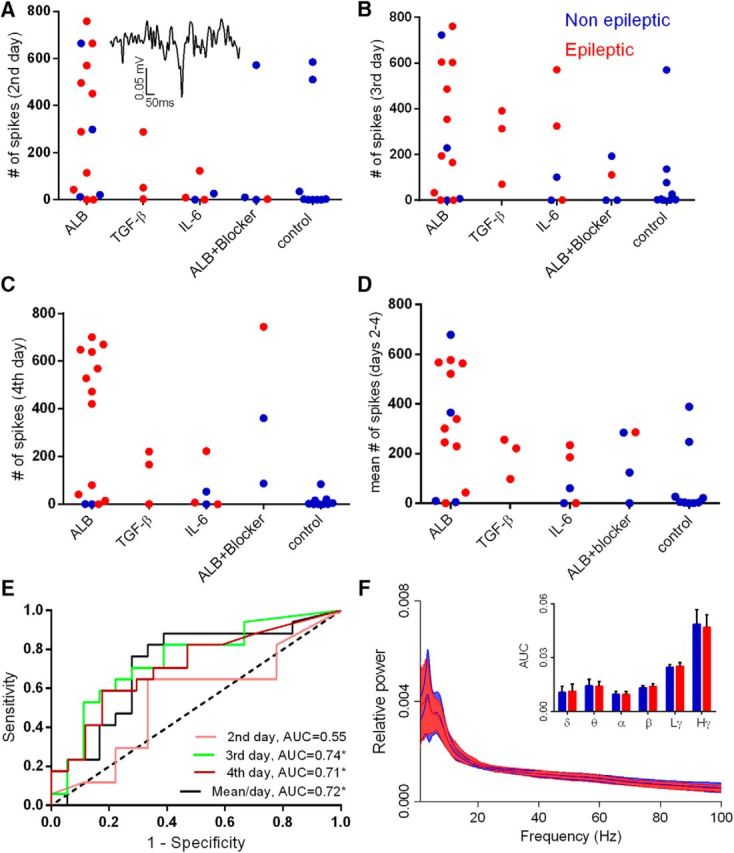
Figure 2.

Spike rate and nondynamic representation of brain rhythms do not predict epilepsy. A–C, The daily rate of epileptiform spikes (see inset) for each animal calculated for days 2, 3, and 4 after treatment initiation in each treatment group. D, Mean number of spikes per day for each animal. E, ROC analysis reveals AUCs up to 0.74 for days 3 and 4 and the mean of days 2–4, with only a 0.55 AUC for day 2 (not significantly different from randomized classification; AUC of 0.5 dotted black line). F, Spectral analysis during the fourth day shows no significant differences in the tested frequency bands when comparing epileptic to nonepileptic animals. Solid lines represent the mean value, and background color depicts the SD. Dex, Dextran; ALB, albumin; Lγ, low gamma; Hγ, high gamma.
