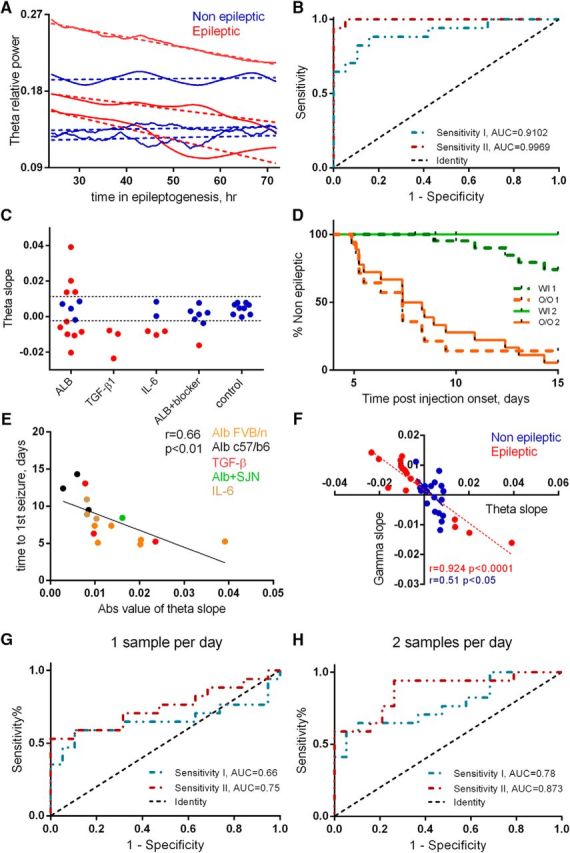
Figure 3.

Theta dynamics as a biomarker for epilepsy. A, Theta activity during the epileptogenic period from representative epileptic and nonepileptic animals (N = 3 in both groups). The smoothed raw traces and the corresponding linear fits are represented by continuous vs dashed lines, respectively. B, ROC analysis was used to assess the predictive potential of two measures of theta dynamics: absolute value of the slope (sensitivity I: AUC = 0.9102, p < 0.0001) and the distance of each slope from the mean slope of control group (sensitivity II: AUC = 0.9969, p < 0.0001). The dotted black line indicates an AUC of 0.5, a reference to randomized classification. C, Slopes of theta activity, superimposed on the margins of the safety range (dashed lines) calculated based on the OOP of sensitivity II. D, Kaplan–Meier analysis shows a significant difference between the OOP-classified groups (p < 0.0001, based on sensitivity I or II). W/I, Within safety range; O/O, out of safety range. E, Theta slopes are inversely correlated with the duration of the epileptogenic period (N = 17, r = 0.66, p = 0.0036). F, Theta and high-gamma slopes are inversely correlated in both epileptic (N = 17, r = 0.924, p < 0.0001) and nonepileptic (N = 19, r = 0.51, p = 0.021) animals. dex, Dextran. G, ROC analyses of a single sample per day (1-h-long segment): AUC = 0.66 (p = 0.1 CI = 0.46–0.86) and AUC = 0.75 (p = 0.018, CI = 0.58–0.92), respectively, to sensitivity I and II. H, ROC analyses of two samples per day (1-h-long segment, every 12 h) AUC = 0.78 (p = 0.004, CI = 0.63–0.94) and AUC = 0.873 (p = 0.0001, CI = 0.76–0.99).
