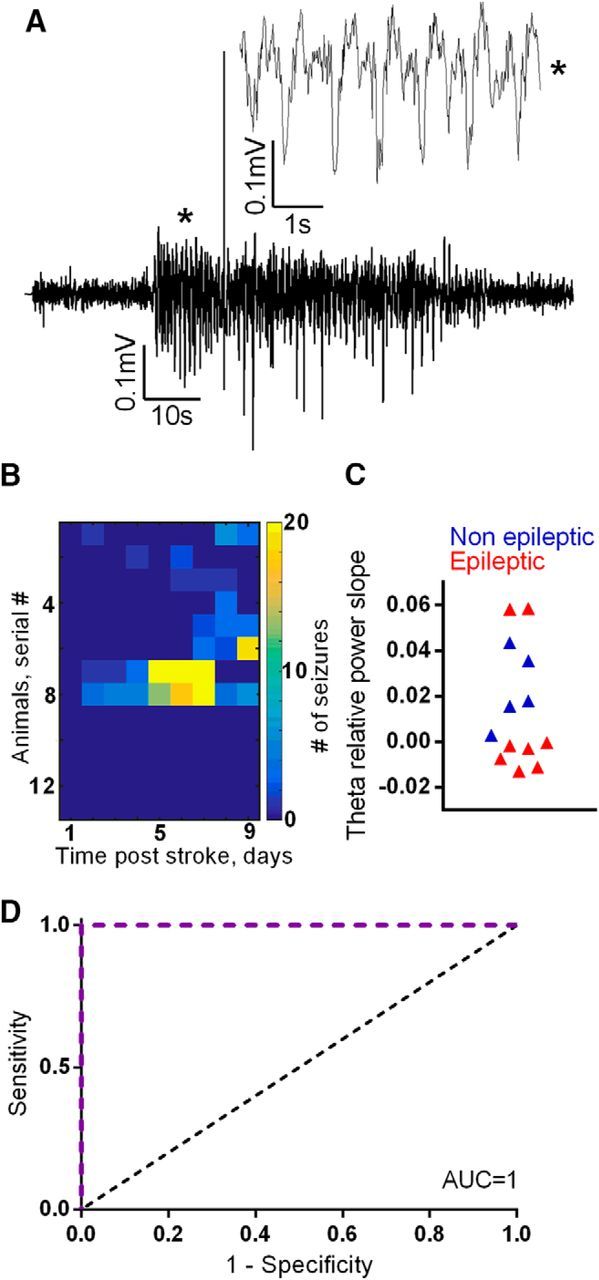
Figure 5.

Theta dynamics as a biomarker for epilepsy in a stroke model of PIE. A, An example of a hippocampal seizure in a model of poststroke epilepsy. B, A heat map of daily seizure rates shows that 5 of the 14 stroke animals remained nonepileptic throughout the recorded period. Among the epileptic animals, the seizure-free period ranged between 1 and 7 d. C, D, Theta slopes (during the first 24 h from treatment initiation) of nonepileptic animals fall within a distinctive range (C), the distance from which can accurately classify disease outcome, as evidenced in the ROC analysis (D), revealing an AUC of 1 (p = 0.003). The dotted black line indicates an AUC of 0.5, a reference to randomized classification.
