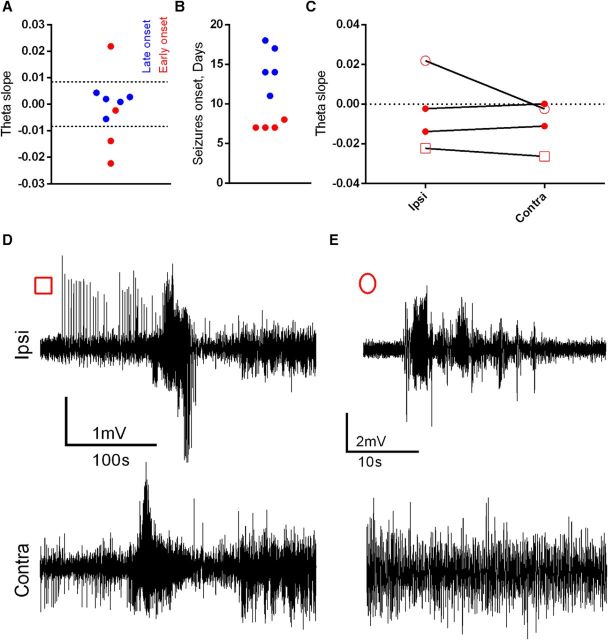
Figure 6.
Theta dynamics as a biomarker for epilepsy in an EISE model of PIE. A, B, The k-means classification (dashed lines) of theta slopes (as recorded from the electrode ipsilateral to stimulation (A) resulted in a division corresponding to the latency of the epileptogenic period (B), with higher absolute slopes associated with earlier epilepsy onsets, whereas slow theta changes corresponded to slower disease development (p = 0.035). C, Comparison of ipsilateral and contralateral theta slopes in early-onset animals highlights one animal (outlined circle) with remarkably different values between the two hemispheres. D, E, Interestingly, this animal (E) also had evident differences in intrahemispheric seizure propagation compared with an animal with relatively consistent slopes [D (outlined square in C)].

