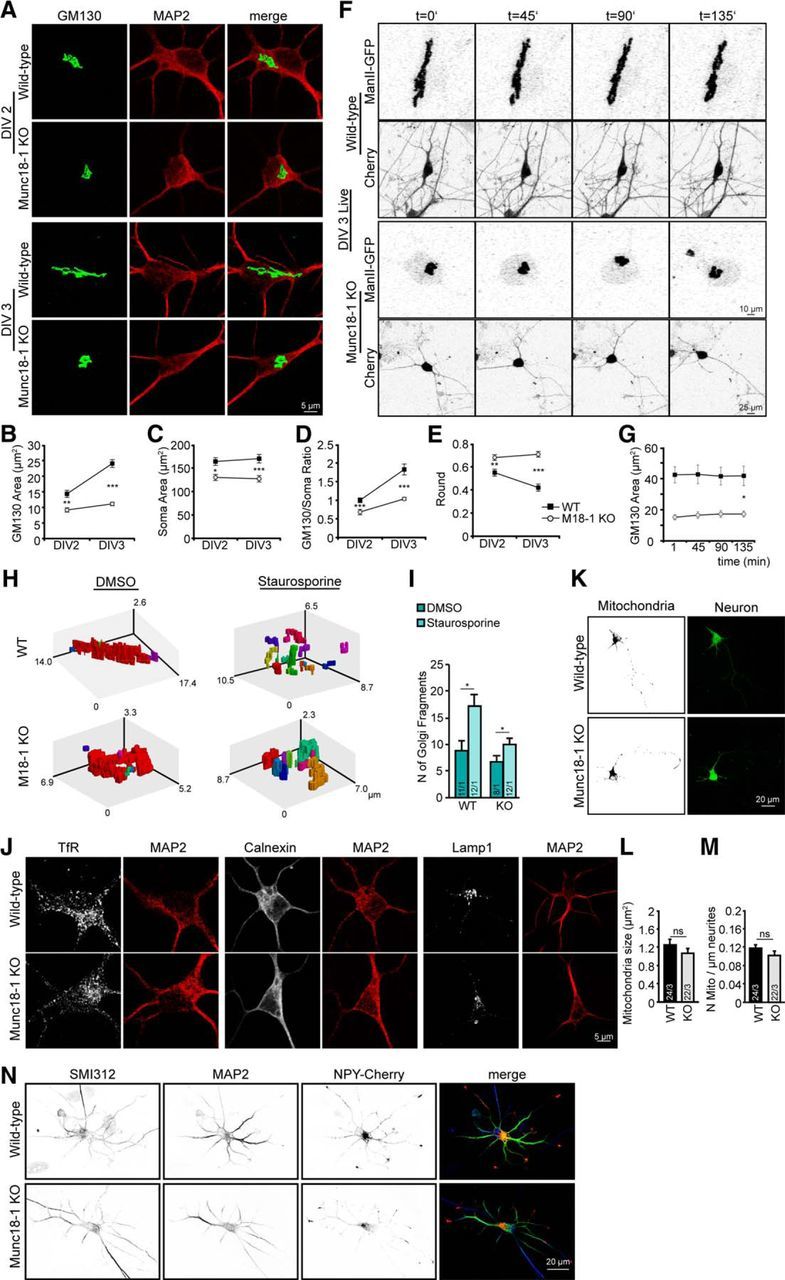
Figure 2.

Cell loss in Munc18-1 KO neurons is preceded by abnormal cis-Golgi morphology, but no changes in other organelles. A, Cortical neurons from WT and Munc18-1 (M18–1) KO, fixed at DIV 2 and DIV 3, were stained for a cis-Golgi marker (GM130) and a dendritic marker (MAP2). B, cis-Golgi area is smaller in Munc18-1 KO. cis-Golgi (GM130) area was measured quantitatively using ImageJ software; DIV 2 WT: 14.3 ± 1.13 μm2; Munc18-1 KO: 9.2 ± 0.70 μm2. **p < 0.01 (two-way ANOVA). DIV 3 WT: 24.0 ± 1.26 μm2; Munc18-1 KO: 11.1 ± 0.58 μm2. ***p < 0.001 (two-way ANOVA). C, Munc18-1 KO neurons are smaller than WT neurons. Soma (MAP2) area was analyzed quantitatively using ImageJ software. DIV 2 WT: 163.86 ± 8.15 μm2; Munc18-1 KO: 130.02 ± 6.52 μm2. *p < 0.05 (two-way ANOVA). DIV 3 WT: 127.10 ± 9.03 μm2; Munc18-1 KO: 170.01 ± 6.81 μm2. ***p < 0.001 (two-way ANOVA). D, cis-Golgi area corrected for soma size; DIV 2 WT: 1.0 ± 0.06; Munc18-1 KO: 0.7 ± 0.07; DIV 3 WT: 1.8 ± 0.15; Munc18-1 KO: 1.0 ± 0.04. ***p < 0.001 (two-way ANOVA). E, WT cis-Golgi neurons grow and elongate over time. Shape was measured quantitatively using ImageJ software. DIV 2 WT: 0.6 ± 0.03; Munc18-1 KO: 0.7 ± 0.02. **p < 0.01 (two-way ANOVA). DIV 3 WT: 0.4 ± 0.03; Munc18-1 KO: 0.7 ± 0.02. ***p < 0.001 (two-way ANOVA). F, live cell imaging of cis-Golgi marker ManII-GFP for 2 h 15 min show again a smaller Munc18-1 KO cis-Golgi. G, Quantification over time of ManII-GFP area using ImageJ software. ManII area at 135 min WT: 41.7 ± 6.26 μm2; Munc18-1 KO: 17.23 ± 1.96 μm2. *p < 0.05 using linear mixed-effects model, auto regression correlation for time AR(1), t(9) = −4.16. H, Representation of 3D cis-Golgi WT versus Munc18-1 KO treated with 1 μm staurosporine to induce apoptosis or DMSO (control). Fragments are individually colored. I, Number of cis-Golgi (GM130) fragments were measured using MATLAB software. Number of fragments: WT DMSO, 9; WT staurosporine, 16; Munc18-1 KO DMSO, 6; Munc18-1 KO staurosporine, 10. *p < 0.05 (Student's t test). J, Cortical neurons from WT and Munc18-1 KO, fixed at DIV 3, were stained for different organelles: (TfR); ER (Calnexin); Lysosome (LAMP1). K, Cortical neurons from WT and Munc18-1 KO were incubated with MitoTracker and imaged live. L, No changes in mitochondria area measured quantitatively using ImageJ software. WT: 1.2 ± 0.12 μm2; Munc18-1 KO: 1.1 ± 0.11 μm2; not significant, p > 0.05 (Student's t test). M, Mitochondria number per total neurite length is equal in Munc18-1 KO and WT, measured quantitatively using ImageJ software. WT: 0.1 ± 0.01 μm−1; Munc18-1 KO: 0.1 ± 0.01 μm−1; not significant, p > 0.05 (Student's t test). N, WT and Munc18-1 KO cortical neurons expressing NPY-Cherry were fixed at DIV 3 and stained for SMI312 (axonal marker) and MAP2 (dendritic marker). No changes in NPY-Cherry were observed between mutant and control neurons. Merge image: blue represents SMI312; green represents MAP2; red represents NPY-Cherry. Data are mean ± SEM.
