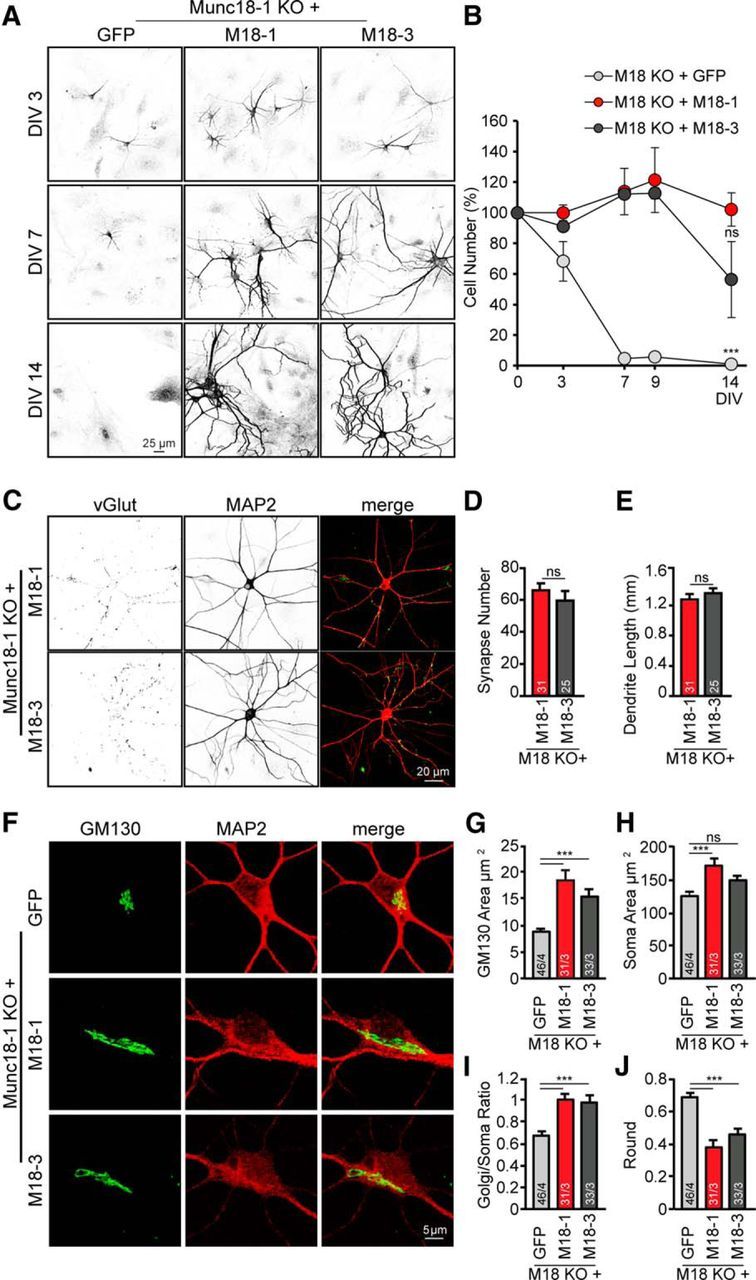
Figure 4.

Munc18-3 expression rescues cell death, neuronal and cis-Golgi morphology in Munc18-1 KO neurons. A, Cortical neuronal cultures from Munc18-1 KO were infected by lentiviral particles with eGFP (control), Munc18-1 (M18–1), or Munc18-3 (M18–3), fixed at different time points (DIV 3, 7, 9, and 14), and stained with a dendritic marker (MAP2). B, Quantification of number of neurons per 97 fields of view; percentage of Munc18-1 KO with Munc18-1 cells: DIV 3, 100 ± 5.16%; DIV 7, 113.8 ± 15.22%; DIV 9, 121.3 ± 21.18%; DIV 14, 102.07 ± 10.97%; Munc18-1 KO with Munc18-3: DIV 3, 90.95 ± 1.21%; DIV 7, 112.17 ± 1.82%; DIV 9, 112.8 ± 3.64%; DIV 14, 56.4 ± 24.86%; Munc18-1 KO with GFP: DIV 3, 72.2% ± 9.93; DIV 7, 4.7 ± 1.52%; DIV 9, 5.8 ± 1.94%; DIV 14, 0.9 ± 0.58%; not significant, p > 0.05. ***p < 0.001 (two-way ANOVA followed by the post hoc Bonferroni's test). C, Cortical neuronal cultures from Munc18-1 KO were infected by lentiviral particles with Munc18-1 or -3, fixed at DIV 14, and stained for vGlut and MAP2. D, Total synapse number was comparable between Munc18-1 and Munc18-3 rescued neurons; synapses Munc18-1: 66.0 ± 4.4; Munc18-3: 59.6 ± 6.1; not significant, p > 0.05 (Student's t test). E, No difference was found in total dendrite length between Munc18-1 and Munc18-3 rescued neurons; dendrite length Munc18-1: 1279.6 ± 73.3 μm; Munc18-3: 1364.4 ± 64.7 μm; not significant, p > 0.05 (Student's t test). F, Cortical neuronal cultures from Munc18-1 KO were infected by lentiviral particles with eGFP (control), Munc18-1 or -3, fixed at DIV 3, and stained with a cis-Golgi marker (GM130) and a dendritic marker (MAP2). G, No changes in cis-Golgi (GM130) area in Munc18-1 and -3 rescued neurons; Munc18-1 KO with GFP: 8.9 ± 0.59 μm2; Munc18-1 KO with Munc18-1: 18.5 ± 1.74 μm2; Munc18-1 KO with Munc18-3: 15.5 ± 1.13 μm2; not significant, p > 0.05. ***p < 0.001 (one-way ANOVA followed by the post hoc Bonferroni's test). H, Soma (MAP2) area was analyzed quantitatively using ImageJ software; Munc18-1 KO with GFP: 125.3 ± 5.98 μm2; Munc18-1 KO with Munc18-1: 171.7 ± 11.47 μm2; Munc18-1 KO with Munc18-3: 148.8 ± 6.62 μm2; not significant, p > 0.05. ***p < 0.001 (one-way ANOVA followed by the post hoc Bonferroni's test). I, cis-Golgi area corrected for soma area showed an increase in the area for both Munc18-1 and -3 groups; Munc18-1 KO with GFP: 0.7 ± 0.04; Munc18-1 KO with Munc18-1: 1.0 ± 0.05; Munc18-1 KO with Munc18-3: 1.0 ± 0.06; not significant, p > 0.05. ***p < 0.001 (one-way ANOVA followed by the post hoc Bonferroni's test). J, cis-Golgi shape showed a more elongated morphology in the Munc18-1 and -3 groups compared with control. Munc18-1 KO with GFP: 0.7 ± 0.02; Munc18-1 KO with Munc18-1: 0.4 ± 0.04; Munc18-1 KO with Munc18-3: 0.5 ± 0.04; not significant, p > 0.05. ***p < 0.001 (one-way ANOVA followed by the post hoc Bonferroni's test). Data are mean ± SEM.
