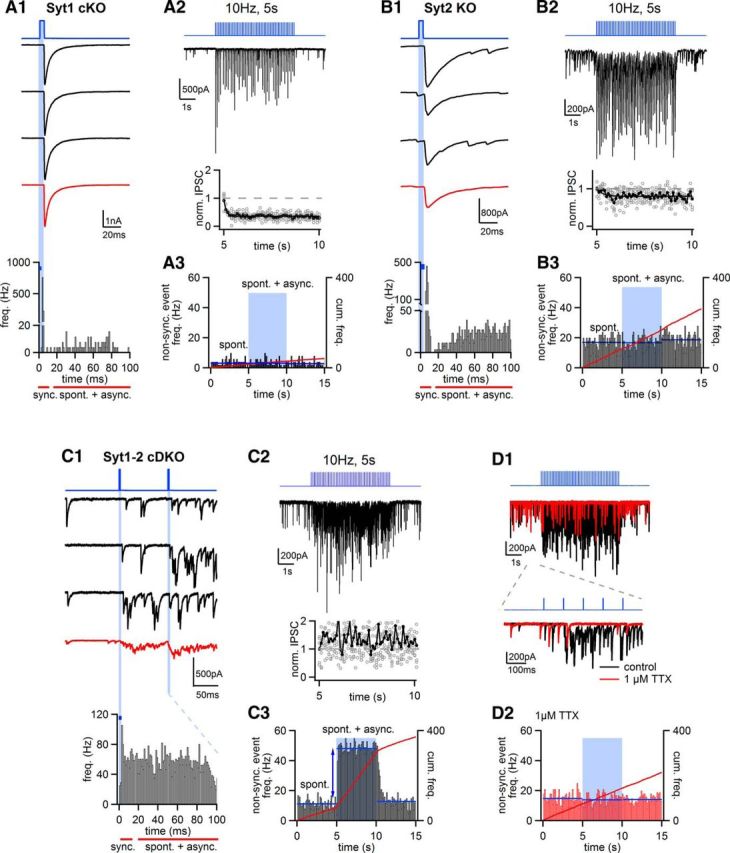
Figure 4.

Disrupted fast inhibitory transmission and increased asynchronous release are limited to Syt1-Syt2 cDKO synapses. A, Optogenetically evoked IPSCs in Syt1 cKO synapses at P14, produced by injecting the lenti: hSyn: oChIEFeYFP-IRES-Cre virus (Fig. 3A) into the MNTB of a Syt1lox/lox, Syt2+/+ mouse at P0. The arrangement of traces follows that shown for the optogenetic experiment in wild-type synapses (Fig. 3D1–D3). A1, Three consecutive IPSCs (black traces) and the average of n = 10 successive IPSCs (red), and the histogram of event frequency for all light stimuli at 10 Hz (bottom). A2, A single example IPSC trace in response to a 10 Hz train of optical stimuli, as well as average and single data points for relative depression (bottom). A3, Histogram of spontaneous and asynchronous IPSC frequency before, during, and after the optogenetic stimulation train. Blue line indicates average spontaneous release frequency during three 5 s intervals. Red line indicates the cumulative release frequency (right axis). Note the clear phasic release and the absence of an increase in spontaneous and asynchronous release in Syt1 cKO synapses. A1–A3, All traces are from the same recording. B, Example of an optogenetic recording in a P12 Syt2−/− mouse, injected at P0 with the lentivirus (thus, Syt2 KO synapses were studied). B1–B3, The arrangement is the same as in A. Note the increased spontaneous release in the Syt2 KO synapses, but no additional asynchronous release during the optogenetic stimulation train. C, Optogenetic stimulation of IPSCs in a Syt1lox/lox, Syt2−/− mouse at P15 (thus, Syt1-Syt2 cDKO synapses were studied after expression of Cre-recombinase and oChIEF). Note the absence of time-locked IPSCs (C1) and the strongly increased asynchronous release frequency (C1, bottom; C3). Upon 10 Hz trains, the remaining IPSC (see C1, red average IPSC trace) does not show depression but rather facilitation (C2, bottom). D, Application of 1 μm TTX in the same recording as shown in C leads to suppression of evoked asynchronous release (D1), but spontaneous release persists as expected. The histogram of spontaneous, and spontaneous plus asynchronous release events (D2), demonstrates that events sampled during the optogenetic stimulation train (D2, time indicated by blue shaded area) correctly quantify the spontaneous release rate.
