Figure 5.
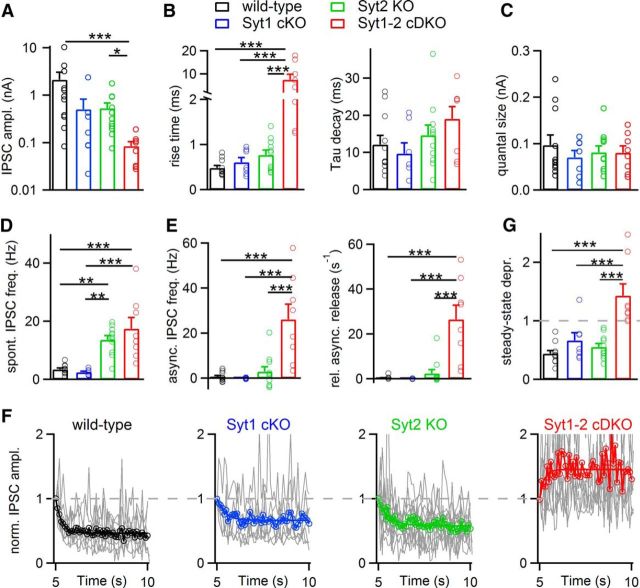
Syt1 and Syt2 act redundantly at the MNTB-LSO synapse to drive fast glycine release. Individual and average values are displayed for optogenetic stimulation experiments in wild-type synapses (black symbols), in Syt1 cKO synapses (blue), in Syt2 KO synapses (green), and in Syt1-Syt2 cDKO synapses (red). A, Individual and average values for IPSC amplitudes. B, The 20%–80% rise time (left) and IPSC decay time constants (right) for the first IPSC of the train of optical stimuli. C, Quantal size as estimated by the average spontaneous IPSC amplitude in each recording. Note the unchanged quantal size across all genotypes. D, Spontaneous release frequency. E, Asynchronous release frequency (left), and relative asynchronous frequency (right), calculated as explained in Results and Materials and Methods. F, Normalized IPSC depression curves during 10 Hz trains of optical stimuli for all genotypes, as indicated. Each gray line indicates the average relative depression curve for an individual recording. Color symbols represent the averages across all cells in each group. Note the strong reversal from depression to facilitation in Syt1-Syt2 cDKO synapses (right). Number of recorded cells were as follows: wild-type, n = 11; Syt1 cKO, n = 7; Syt2 KO, n = 11; Syt1-Syt2 cDKO, n = 8. Data are mean ± SEM. The significance was tested with ANOVA or the Kruskal–Wallis test (for IPSC amplitudes and quantal content), and is only indicated for those pairs that showed a significant difference. *p < 0.05. **p < 0.01. ***p < 0.001. A–G, For most comparisons, only the Syt1-Syt2 cDKO synapses showed significant differences to the remaining groups (see asterisks), with exception of the spontaneous release rate (D), which was also significantly different in Syt2 KO synapses.

