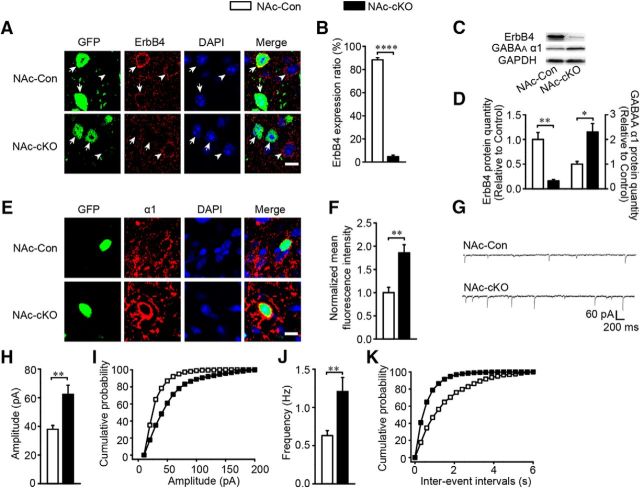
Figure 10.
Precise Erbb4 deletion in the NAc core MSNs increased inhibitory transmission and GABAAR α1 expression. A, B, Images of Erbb4 deletion in the NAc core and the histogram of statistical analysis (n = 2395 cells of 3 NAc-Con and 2023 cell of 4 NAc-cKO). Arrow, GFP-positive cells; arrowheads, GFP-negative cells. Scale bar, 10 μm. C, D, Immunoblots and quantification of ErbB4 and GABAAR α1 protein from the NAc core of NAc-Con and NAc-cKO mice (n = 4). E, F, Images of GABAAR α1 overexpression in NAc-cKO mice resembling cKO mice (n = 28 cells from 4 NAc-Con and 50 cells from 5 NAc-cKO). Scale bar, 10 μm. G–K, mIPSC frequency and amplitude were increased in NAc-cKO mice with sample traces, histograms, and cumulative distribution plots (n = 28 cells from 4 NAc-Con and 25 cells from 3 NAc-cKO). In this figure, all virus expression was restricted to the NAc core, so all data are included in the analysis. Statistical significance was calculated with two-tailed t test for unpaired data (B, D, F) or K-S t test (H, J). All data are shown as mean ± SEM. NS, No significant difference.

