Figure 3.
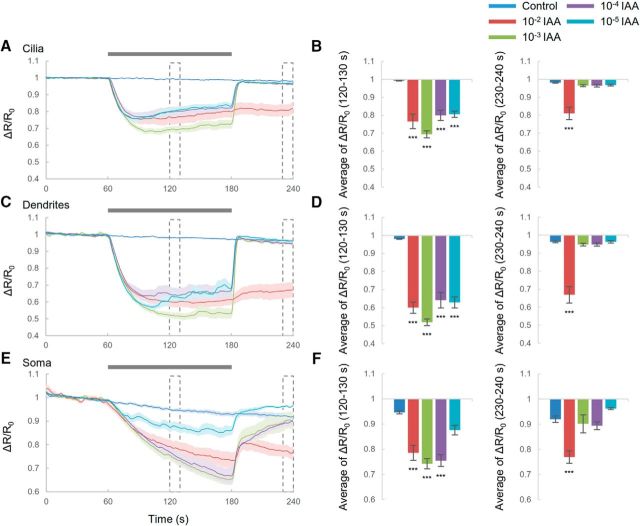
Ca2+ responses to odor in each compartment of AWC sensory neurons. A, C, E, Time courses of Ca2+ responses to IAA in cilia (A), dendrites (C), and soma (E) of AWC sensory neurons. Traces are averages of the relative fluorescence ratio (blue/green). The control corresponds to S-basal flow. Gray bar is the duration of odor stimulus. Shading in the graphs shows SEM. Dotted boxes indicate the specified time in bar graphs. B, D, F, Summaries of Ca2+ responses in cilia (B), dendrites (D), and soma (F) during each time. Error bar indicates SEM. n = 10 for each condition. (B, left, p < 10−5, p < 10−5, p < 10−5, and p < 10−5; B, right, p < 10−4, p = 0.866, p = 0.851, and p = 0.925; D, left, p < 10−9, p < 10−9, p < 10−9, and p < 10−9; D, right, p < 10−4, p = 0.968, p = 0.970, and p = 1.000; F, left, p < 0.001, p < 0.001, p < 0.001, and p = 0.0778; F, right, p < 0.001, p = 0.934, p = 0.812, and p = 0.448; 10−2, 10−3, 10−4, and 10−5 IAA, respectively; Dunnett's test). ***p < 0.001, significant difference.

