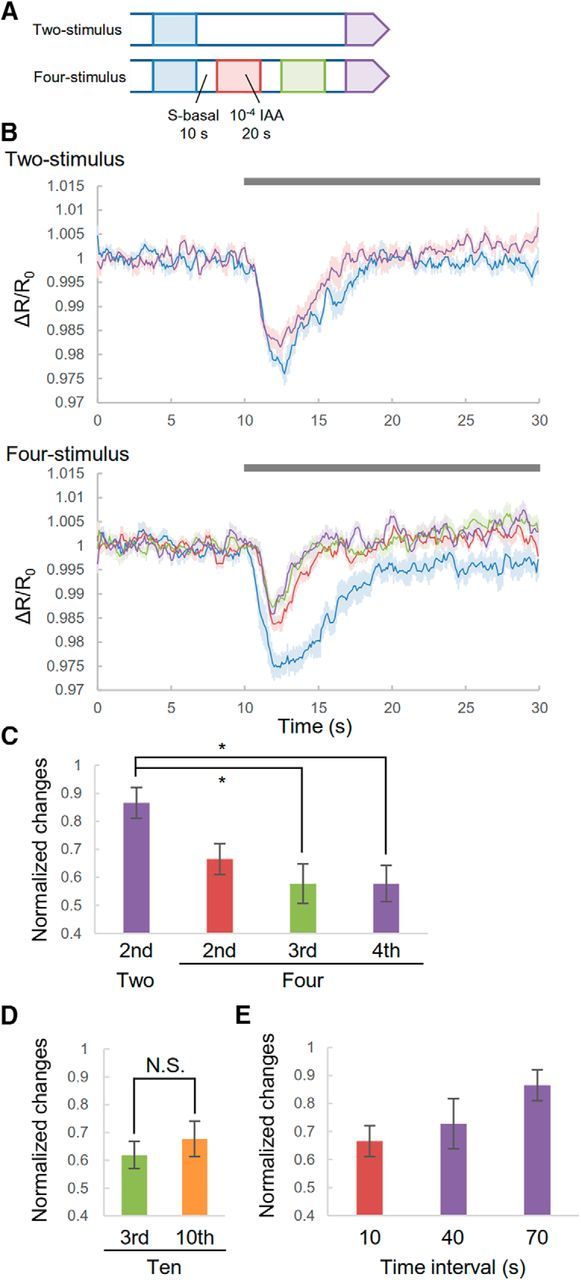
Figure 6.

cGMP responses in cilia to repeated stimuli. A, Experimental procedure. Worms were exposed to odor for 20 s every 30 s two or four times. B, cGMP responses to odor in the two-stimulus (top) and four-stimulus conditions (bottom). Each trace was extracted from sequential data consisting of 10 s before and 20 s after odor application. Gray bar is the duration of odor stimulus. Shading in the graphs shows SEM. C, Summaries of cGMP responses. Each variation in cGMP response is normalized by the variation of the first responses. D, Third and tenth cGMP response to odor in the 10-stimulus condition. E, cGMP response to sequential application of odor for different time intervals. Each variation of the second or last cGMP responses for different time intervals was normalized by the variation of the first response. The data for 10 and 70 s are the same in C. Error bar indicates SEM. n = 10, 11, 11, and 10 (two-, four-, and 10-stimulus presentations plus 40 s time interval stimulus presentation, respectively). (C, p = 0.01977, p = 0.004951, and p = 0.003289; second, third, and last responses, respectively; D, p = 0.3652; Student's t test). *p < 0.05, significant difference with Bonferroni correction.
