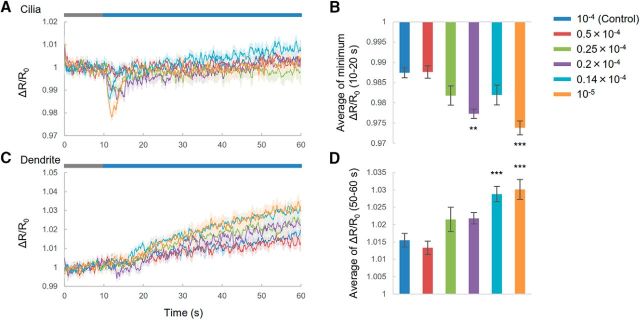
Figure 7.
cGMP responses to relative changes in odor. A, C, cGMP responses to relative changes in diluted IAA in cilia (A) and dendrites (C). Blue bar indicates the duration of 10−4 diluted IAA application. Gray bar is the duration of the test stimulus. Shading in the graphs shows SEM. B, D, Summaries of cGMP responses. Error bar indicates SEM. Datasets are as follows for 10−4, 0.5 × 10⁻⁴, 0.25 × 10⁻⁴, 0.2 × 10⁻⁴, 0.14 × 10⁻⁴, and 10−5 IAA, respectively: cilia and dendrites, n = 10, 10, 9, 9, 11, and 10; soma, n = 10, 10, 9, 9, 11, and 10. (B, p = 1.00000, p = 0.14898, p = 0.00176, p = 0.13384, and p < 0.001; D, p = 0.953, p = 0.296, p = 0.249, p < 0.001, and p < 0.001; 0.5 × 10⁻⁴, 0.25 × 10⁻⁴, 0.2 × 10⁻⁴, 0.14 × 10⁻⁴, and 10−5 IAA, respectively; Dunnett's test). **p < 0.01 and ***p < 0.001, significant difference.

