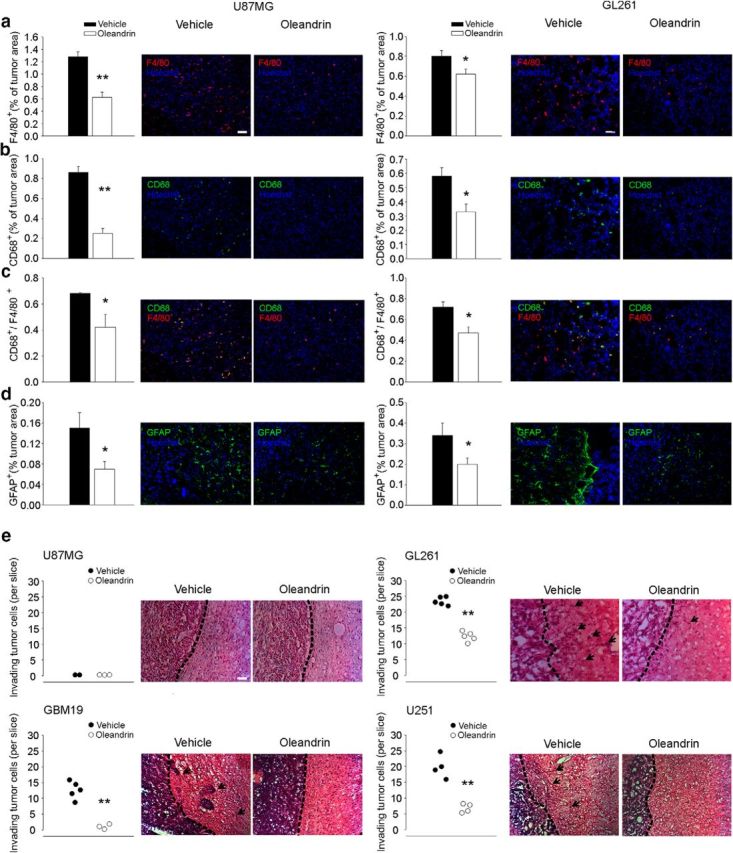
Figure 6.

Effect of oleandrin in the brains of mice implanted with human or murine cells. a–c, Quantification of F4/80+ (a), CD68+ (b), and F4/80+/CD68+ (c) cells in the tumor area upon oleandrin or vehicle treatment. Bars represent the mean (±SEM) area expressed as percentage of total tumor area. Representative immunofluorescence images are shown on the right (n = 4 mice per condition; **p < 0.01, *p < 0.05 Student's t test). Scale bar, 100 μm. d, Quantification of GFAP+ cells at the border of tumor mass (mean ± SEM of area of as percentage of the tumor area; n = 4 mice per condition; *p < 0.05, Student's t test) 17 d after U87MG or GL261 transplantation in mice treated with vehicle or oleandrin, as indicated. Representative immunofluorescence images are shown on the right. e, Mean number (±SEM) of different human and murine glioma cells invading the brain parenchyma for >150 μm (n = 3–5 mice per condition; **p < 0.01, Student's t test). Right, Representative coronal brain sections stained with hematoxylin and eosin. Black arrows indicate invading glioma cells beyond the main tumor border (dashed line). Scale bars, 10 μm for all panels.
