Figure 7.

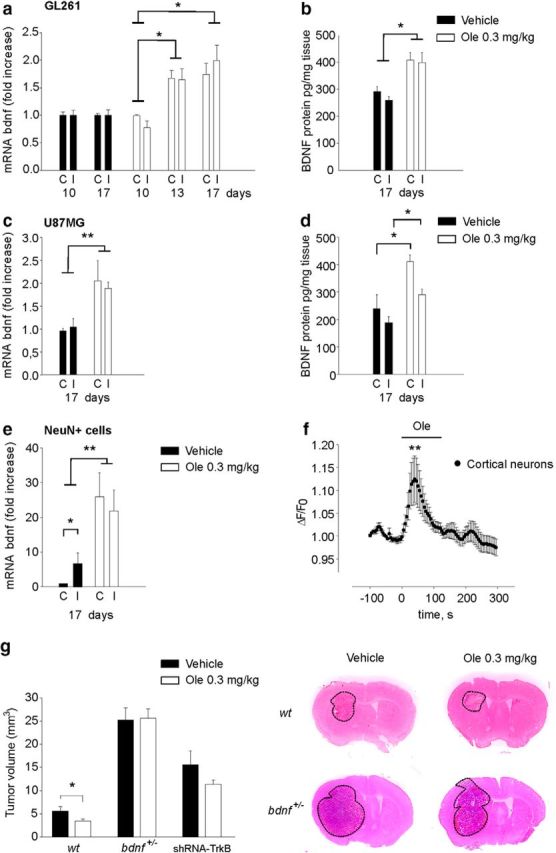
Oleandrin induces BDNF expression. Expression of bdnf mRNA (a, c) and protein (b, d) in contralateral (C) and ipsilateral (I) hemispheres of GL261-bearing or U87MG-bearing mice treated with oleandrin 0.3 mg/kg, as indicated. Results of RT-PCR analysis are shown as the fold increase with respect to control (n = 5–4; *p < 0.05, **p < 0.01, one-way ANOVA followed by Dunn's post hoc test). e, Expression of bdnf (mRNA) in NeuN+ cells isolated from contralateral and ipsilateral hemispheres of GL261-bearing mice treated with vehicle or oleandrin. Results are shown as the fold increase with respect to control (n = 5; *p < 0.05, **p < 0.01, one-way ANOVA followed by Tukey post hoc test). f, Effect of 3 μm oleandrin (the bar refers to 2 min) on Ca2+ transients in cortical neurons, expressed as ΔF/F0 (n = 15, **p < 0.01, χ2 test). g, Mean tumor volumes (GL261 and shRNA-TrkB GL261) in WT (C57BL/6) and/or bdnf+/− mice treated with oleandrin (0.3 mg/kg), as indicated (n = 5, *p < 0.05, one-way ANOVA followed by Holm–Sidak post hoc test). Representative coronal brain sections are shown above for WT and bdnf+/− mice (at 17 d).
