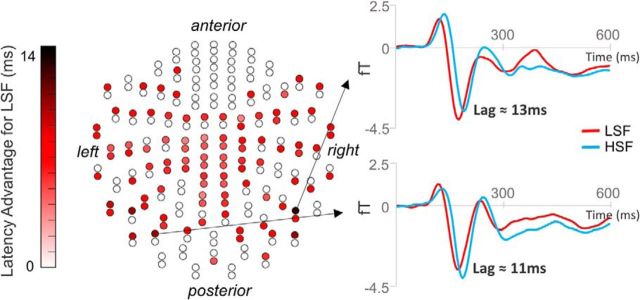
Figure 3.
Latency advantage for LSF faces. Left, A sensor map displaying 204 planar gradiometers. Red represents a sensor that showed a significant time difference between LSF and HSF. Darker red represents an earlier neural effect of LSF compared with HSF faces. Right, Activity at two example sensors that showed the greatest time difference.

