
Figure 1.
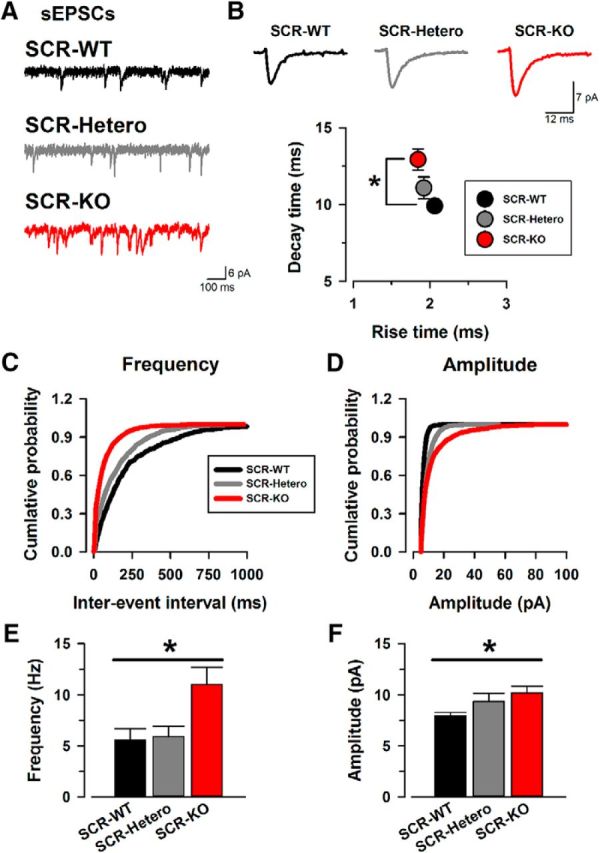
SCR-KO mice facilitate spontaneous excitatory transmission release in the ACC. A, Sample traces of sEPSCs from SCR-WT (top), SCR-Hetero (middle), and SCR-KO (bottom) mice. B, Sample traces of averaged sEPSCs in SCR-WT (left), SCR-Hetero (middle), and SCR-KO (right) mice. Also shown is the averaged rise time and decay time of sEPSCs in the three groups. There were significant differences in rise time and decay time between SCR-KO and SCR-WT mice (rise time: SCR-KO, 1.9 ± 0.1; SCR-Hetero, 1.9 ± 0.1; SCR-WT, 2.1 ± 0.1 ms; decay time: SCR-KO, 12.9 ± 0.7; SCR-Hetero, 11.1 ± 0.7; SCR-WT, 9.9 ± 0.2 ms). C, Cumulative probability of the frequencies in sEPSCs. The curve of SCR-KO mice shows a leftward shift compared with SCR-WT mice. D, Cumulative probability of the amplitudes in sEPSCs. The curves of all groups are similar. E, Average frequency of sEPSCs in SCR-WT, SCR-Hetero, and SCR-KO mice. SCR-KO mice showed significantly higher frequencies of sEPSCs compared with SCR-WT mice (SCR-KO, 11.0 ± 1.7 Hz; SCR-Hetero, 6.9 ± 1.0 Hz; SCR-WT, 5.6 ± 1.1 Hz). F, Average amplitude of sEPSCs in SCR-WT, SCR-Hetero, and SCR-KO mice. The averaged amplitudes of sEPSCs show a significant difference between SCR-KO and SCR-WT mice (SCR-KO, 10.2 ± 0.6; SCR-Hetero, 9.4 ± 0.8; SCR-WT, 7.9 ± 0.4 pA). *p < 0.05 compared with SCR-WT mice. Data are presented as mean ± SEM.