Figure 1.
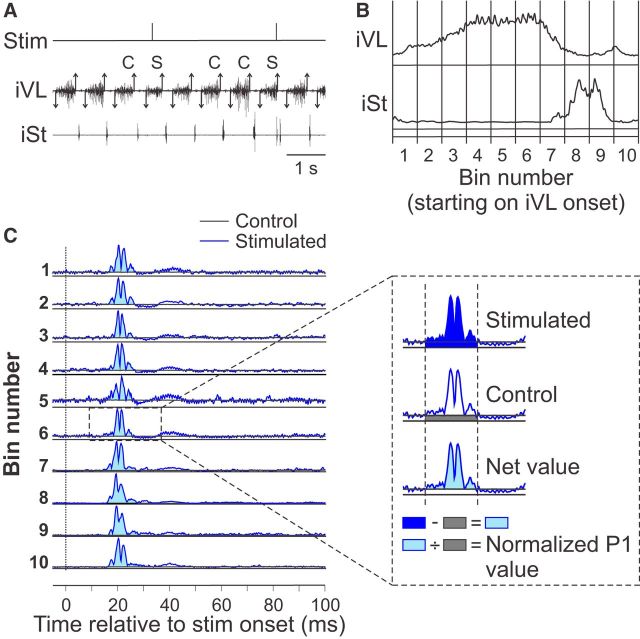
Reflex analysis. A, Burst onsets (downward arrows) and offsets (upward arrows) of an extensor muscle ipsilateral to the stimulation were visually determined. Step cycles were defined from successive burst onsets of this extensor. Cycles were then categorized as control (C, cycles with no stimulation) or stimulated (S, cycles with a stimulation). B, Control and stimulated cycles were then averaged for the different muscles and normalized to the step cycle. Normalized cycles were then separated into 10 equal bins. C, Control and stimulated cycles were sorted into these 10 bins. For instance, if stimuli were given in the first 10% of the cycle, then these cycles were sorted into bin 1 and so on. The control cycles provide a blEMG in each bin. The onset and offset of short-latency responses, defined as a prominent positive deflection away from the blEMG, were then determined visually. The EMG within that window was integrated and the blEMG occurring in the same time window was then subtracted to provide a net reflex value. This net value was then divided by the blEMG occurring in the same time window to provide a normalized response. iVL, Ipsilateral vastus lateralis; iSt, ipsilateral semitendinosus.

