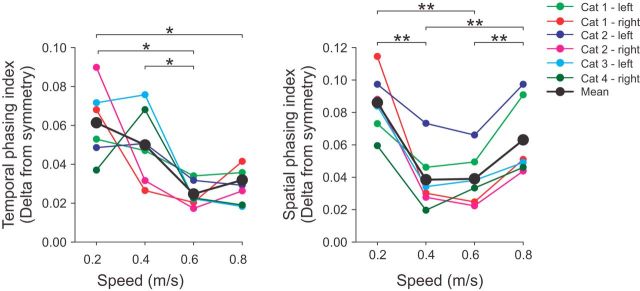
Figure 10.
Temporal and spatial symmetry of the locomotor pattern across speeds. Temporal and spatial phasing intervals were measured. The deviation from a perfect symmetry of 0.5 was then calculated at each speed. Data are shown for individual cats (each data point is the average of 30 cycles) and for pooled data (i.e., six sessions from four cats). Asterisks indicate significant differences between speeds (pairwise comparisons): *p < 0.05; **p < 0.01; ***p < 0.001.

