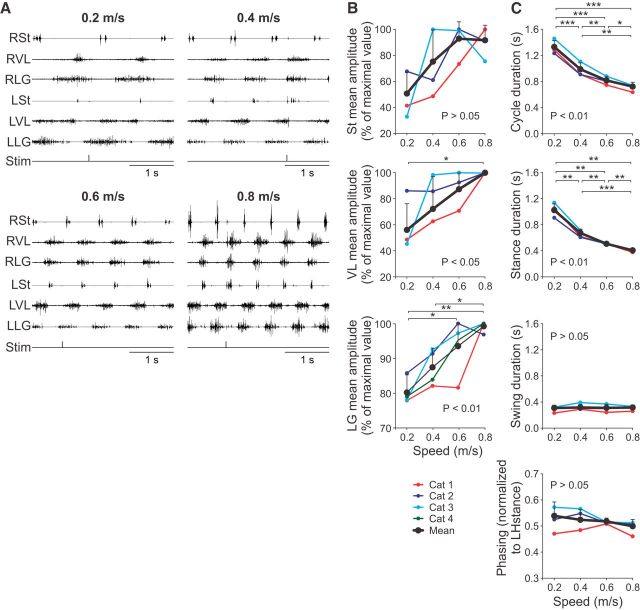
Figure 2.
Modulation of the locomotor pattern with increasing speed. A, Each panel shows the EMG from the right (R) and left (L) St, VL, and LG. The stimulation (Stim) of the left SP nerve is shown below the EMGs. Data are from Cat 4. B, Mean amplitude of the St, VL, and LG EMG bursts normalized to the maximal value obtained at one speed. C, Cycle, stance, and swing durations and temporal phasing at the different speeds. Data are shown for individual cats and for the group (n = 4 cats). p-values indicate if there was a significant effect of speed (one-factor repeated-measures ANOVA) at the 0.05 level. Asterisks indicate significant differences between speeds (pairwise comparisons): *p < 0.05; **p < 0.01; ***p < 0.001.

