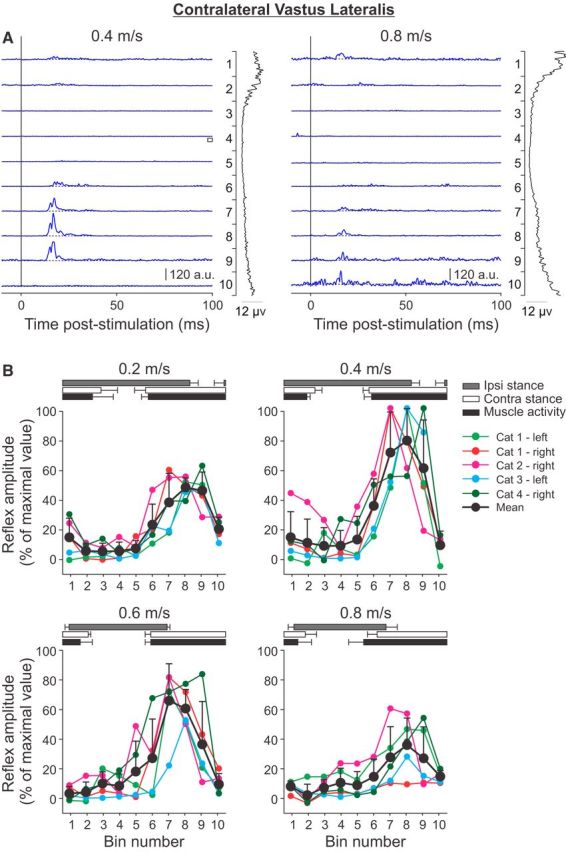
Figure 7.

Phase-and speed-dependent modulation of cutaneous reflexes in the contralateral VL across speeds. A, Cutaneous reflexes evoked in a spinal cat (Cat 3) at 0.4 and 0.8 m/s and separated into 10 bins. The blue lines are the rectified EMG waveforms obtained with stimulation (average of 7–21 cycles per bin). The dashed lines show the background level of EMG (average of >60 control cycles). The EMG waveform shown vertically on the right of each panel is the rectified activity of the muscle at each speed (average of >60 control cycles). B, P1 responses were averaged in each bin and expressed as a percentage of the maximal value obtained at 0.4 m/s. Data are shown for individual nerve stimulations (mean) and for pooled data (mean ± SD). The horizontal bars above the panels show the stance phases for the ipsilateral (Ipsi) and contralateral (Contra) hindlimbs, along with the period of activity of the contralateral VL obtained from 30 cycles. Error bars indicate mean ± SD. In A and B, the locomotor cycle was synchronized to onset of the ipsilateral VL.
