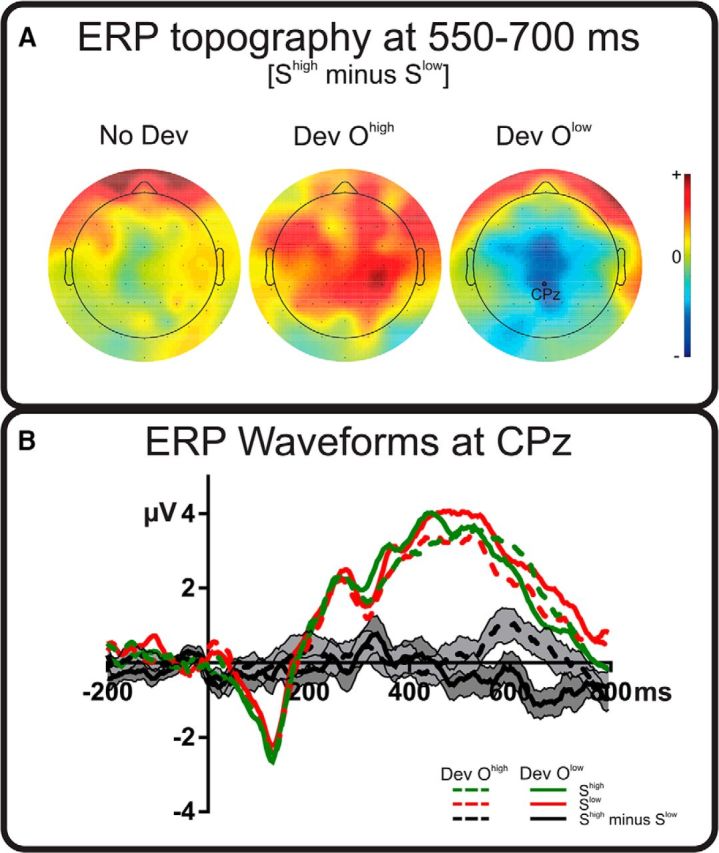
Figure 4.

Long-latency ERPs. Results in the 550–700 ms time window are shown. A, Topographical figures mapping the differences between stimuli that were more frequently related to high-value outcome (Shigh) and to low-value outcome (Slow) for all conditions. Relative scale (minimum/maximum values): −1/+1 μV. B, Mean evoked activity locked to stimulus onset (100 ms baseline also shown) for the Shigh and Slow at relevant electrode CPz. Data for the two devalued conditions, Dev Ohigh and Dev Olow, are shown. Black lines represent the Shigh minus Slow difference waveforms for each devaluation condition. Shaded areas represent SEM of these differences.
