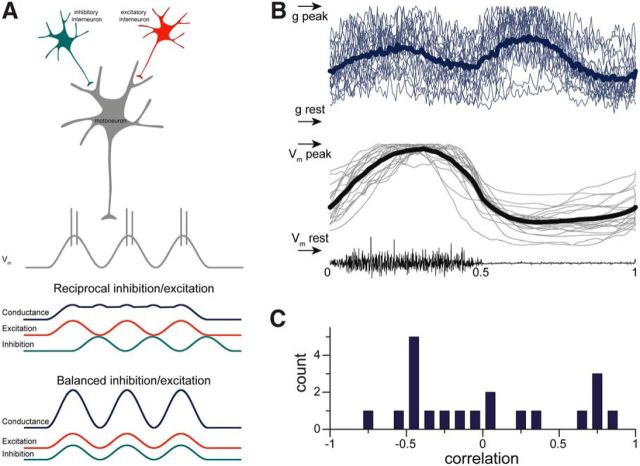
Figure 10.
Synaptic intensity does not correlate with Vm. A, The synaptic conductance during Vm oscillations predicted by the balanced and the reciprocal inhibition and excitation models. B, Synaptic conductance calculated from VC recordings peaks twice during the scratch cycle (n = 20; light color traces depict records of each motoneuron, and dark color lines depict mean). From the top: synaptic conductance calculated from VC recordings at −65 mV and at 0 mV; Vm of motoneuron; HF nerve activity. C, Correlation between synaptic conductance and Vm varies from positive to negative.

