
Figure 12.
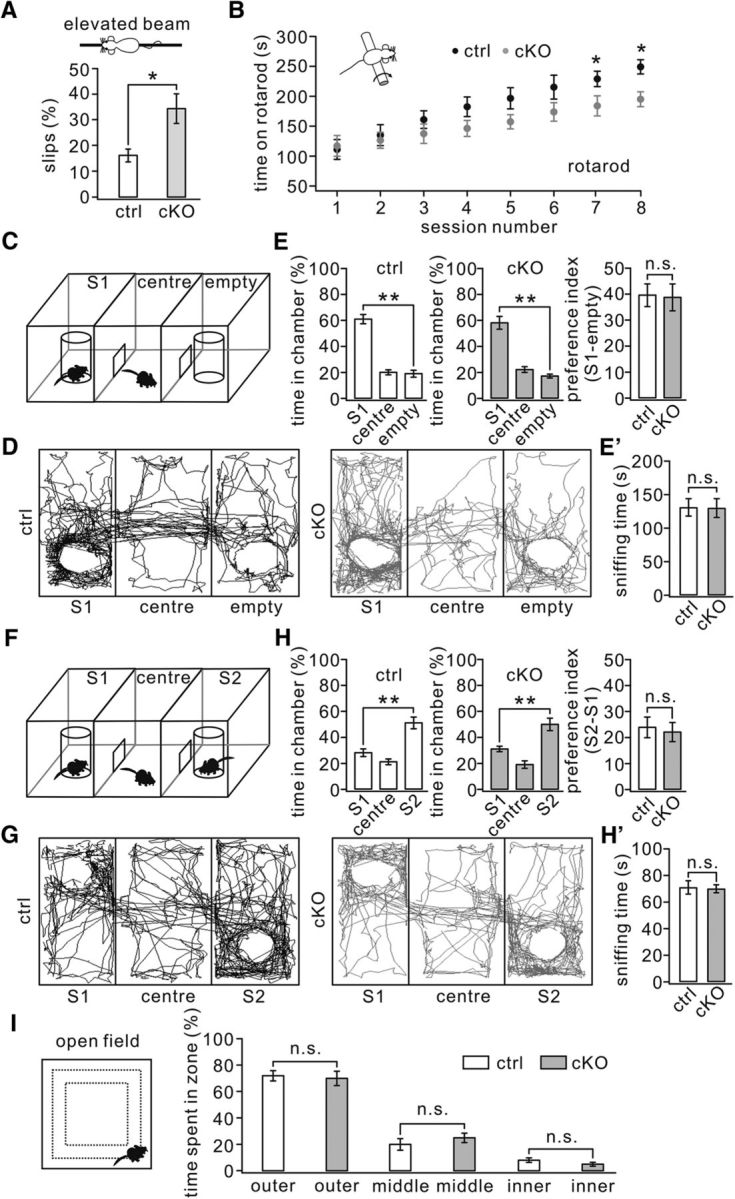
Impaired motor learning but normal social interactions were seen in TFR1flox/flox;pCP2-cre mice. A, Percentage of steps with hindpaw slips during runs on an elevated horizontal beam. TFR1flox/flox: 16 ± 2%. TFR1flox/flox;pCP2-cre: 34 ± 6%. n = 10 pairs; p = 0.023. B, Time spent on the accelerating rotarod for control and cKO mice. TFR1flox/flox: 229 ± 13 s; TFR1flox/flox;pCP2-cre: 184 ± 17 s for session 7 (p = 0.019); TFR1flox/flox: 249 ± 12 s; TFR1flox/flox;pCP2-cre: 195 ± 12 s for session 8. n = 10 pairs. p = 0.014. C, Configuration of a three-chamber social interaction evaluated by relative time spent in each chamber. D, Example movement traces of a control mouse and a cKO mouse. E, Summary of spent time in S1, center, and empty chambers of control (n = 12) and cKO (n = 11) mice showing that both genotypes preferred to spend time in the room with S1 compared with the empty room. E′, Summary of sniffing time onto S1 of control and cKO mice. F, Configuration of a three-chamber after the introduction of S2. G, Example movement traces of a control mouse and a cKO mouse mice in the three-chamber with S1 and S2. H, Summary of spent time in S1, center, and S2 chambers of control (n = 12) and cKO (n = 11) mice showing that both genotypes preferred to spend time in the room with S2 compared with S1. H′, Summary of sniffing time onto S2 of control and cKO mice. I, In the open-field test, control (n = 17) and cKO mice (n = 15) showed no differences in time spent in the inner (control: 8 ± 4%; cKO: 5 ± 1%), middle (control: 20 ± 4%; cKO: 25 ± 3%), or outer (control: 72 ± %; cKO: 70 ± 5%) zones. *p < 0.05, **p < 0.01. n.s., Not significant.