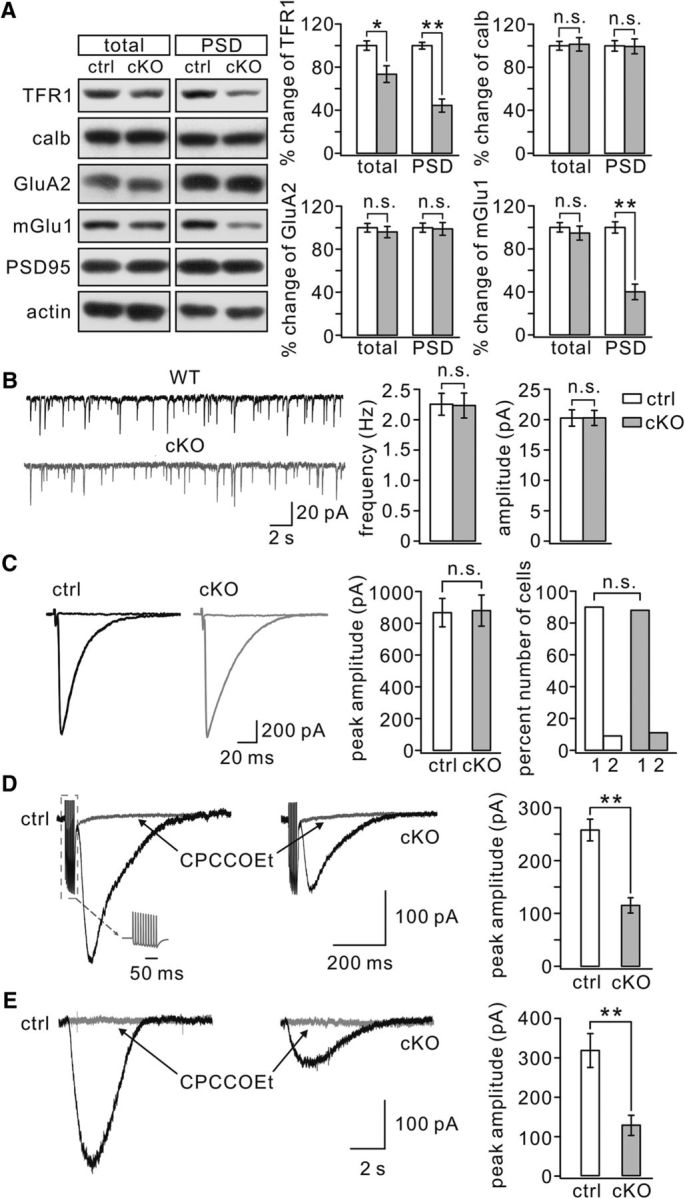
Figure 4.

Synaptic mGlu1 is reduced in TFR1flox/flox;pCP2-cre mice. A, Cerebellar (total) and PSD fractions from control and cKO mice were probed with antibodies to TFR1, calbindin (calb), GluA2, and mGlu1. GAPDH and PSD95 were internal controls for total and PSD, respectively. Histograms show percentage changes of proteins in cKO mice relative to control (n = 4 pairs). TFR1: 73 ± 7% (total; p = 0.014) and 44 ± 6% (PSD; p = 0.0067). calb: 101 ± 6% (total; p = 0.69) and 99 ± 7% (PSD; p = 0.45). GluA2: 96 ± 5% (total; p = 0.44) and 99 ± 6% (PSD; p = 0.37). mGlu1: 90 ± 6% (total; p = 0.31) and 40 ± 7% (PSD; p = 0.0076). B, mEPSCs recorded from control (n = 10) and cKO (n = 10) PCs. Averages of frequency were 2.3 ± 0.2 Hz (control) and 2.2 ± 0.2 Hz (cKO; p = 0.56). Averages of amplitude were 21 ± 1.3 pA (control) and 21 ± 1.2 pA (cKO; p = 0.67). C, Sample recordings of climbing fiber–EPSCs from control and cKO PCs. Three traces evoked by different intensities are superimposed. The peak averages of climbing fiber–EPSCs were 867 ± 89 pA (control, n = 23) and 880 ± 98 pA (cKO, n = 25; p = 0.25). Right, Percentages of discrete steps (1 or 2) of climbing fiber–EPSCs. For control: 90% (1) and 9% (2), n = 23. For cKO: 88% (1) and 11% (2), n = 25. D, Example mGlu1-EPSCs in response to burst stimulations (gray inset) in control and cKO cells. mGlu1-EPSCs were blocked by its antagonist CPCCOEt (100 μm). E, Slow currents were evoked by a pulse (10 psi, 20 ms) of aCSF containing DHPG (100 μm) and blocked by mGlu1 antagonist CPCCOEt (100 μm). *p < 0.05. **p < 0.01. n.s., Not significant.
