Figure 6.

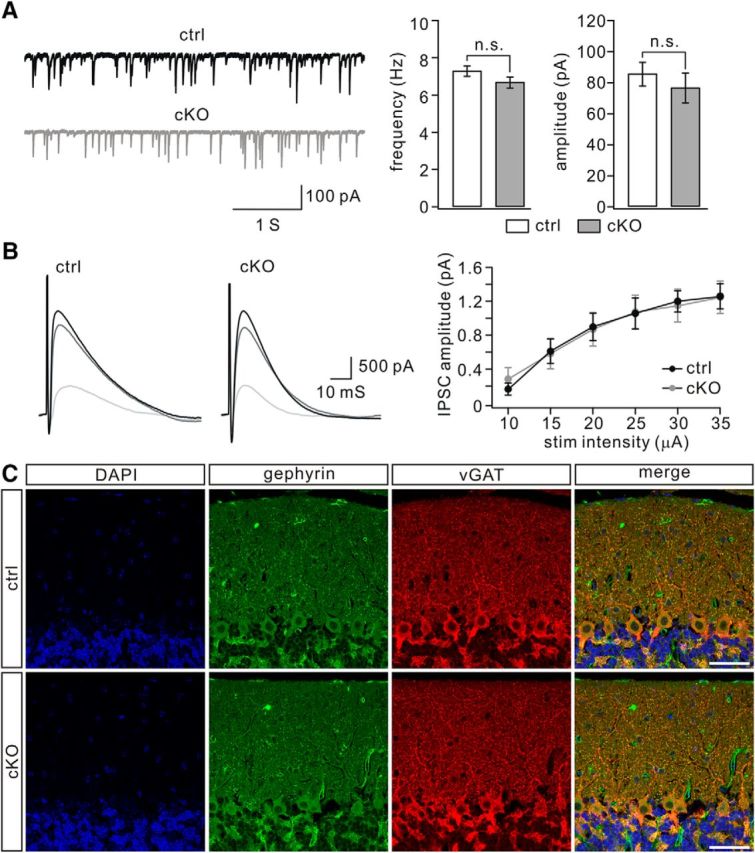
GABAergic synaptic transmission onto PCs is not changed by TFR1 deletion. A, mIPSCs recorded from control (n = 9) and cKO (n = 9) PCs. Averages of frequency were 7.3 ± 0.3 Hz (control) and 6.7 ± 0.3 Hz (cKO; p = 0. 26). Averages of amplitude were 85 ± 8 pA (control) and 76 ± 10 pA (cKO; p = 0.18). n.s., Not significant. B, Superimposed eIPSCs were recorded from a single PC of control and cKO mice in response to stimulations at 15, 25, and 35 μA. Each trace is derived from averaging IPSCs of three successive traces recorded every 20 s. The right panel shows the relationship between eIPSC amplitude and a series of stimulation intensity for control (n = 12) and cKO (n = 11) mice. C, Immunofluorescence using antibodies to gephyrin and vGAT in control and cKO mice (P21). Nuclei were stained with DAPI (blue). Both gephyrin and vGAT showed a dotted appearance in the molecular layer and were mostly overlapped, suggesting the putative GABAergic synapses. The density of double-labeled puncta was 5.4 ± 0.2/100 μm2 in TFR1flox/flox mice (n = 6) and 5.2 ± 0.2/100 μm2 in TFR1flox/flox;pCP2-cre mice (n = 6). Scale bars, 50 μm.
